
Love Data Week
Join us February 9-13 for both online and in-person events.
Love Data Week was established in 2016. What was originally created in the US quickly grew to an international event in which a wide range of institutions, organizers, scholars, students and data lovers from around the globe could celebrate their data. It takes place every year during the week of Valentine’s Day. The aim was to celebrate data in all its forms, promote good research data management strategies, share data success/failures, and ask hard questions about the role of data in our lives.
Join us February 9-13 , 2026, as we celebrate the University at Buffalo's Love Data Week. The week will consist of presentations, workshops, and informational sessions that are open University-wide. We look forward to seeing you!
2026 Love Data Week Events
On-Line Sessions - Monday Feb 9 thru Thursday Feb 12
| Timeslot | Duration | Presentation (Click the Title to Register) | Presenter(s) | Notes |
|---|---|---|---|---|
| 9:00am | 45 min | Recording - Ethical Data Dilemmas in Budget Development Presentation - Ethical Data Dilemmas in Budget Development
Participants will learn strategies to strengthen transparency, consistency, and integrity in budget planning. | Peter DiNunzio and Bin Chen | Staff focused |
| 10:00am | 60 min | Recording - Introducing Computational Thinking Presentation - Introducing Computational Thinking Additional Material - Introducing Computational Thinking
Computational thinking is an essential prerequisite for anyone wanting to learn to program computers and write code. This workshop will take you through the steps to develop a computational mindset. | Scott Peterson | Workshop |
| 11:00 am | 45 min | Recording - Recipe for Understanding University Data - Data CookBook Presentation - Recipe for Understanding University Data - Data CookBook
Have you ever reviewed a report and encountered terminology that was unfamiliar, leaving you uncertain about whom to consult or where to begin? You may have sought to understand the distinction between regular and externally funded enrollment or wished to clarify when interest begins to accrue on a Federal Direct Subsidized versus an Unsubsidized Loan. Perhaps you have come across the term FTE and wondered about its precise meaning.
This session will guide you to the resources that provide clear, authoritative answers to questions such as these. | Michele Sedor and Lynne DePasquale | Presentation |
| 12:00pm | 60 min | Recording - Data Organization in Excel: Love Canal Edition Additional Material - Data Organization in Excel: Love Canal Edition Presentation - Data Organization in Excel: Love Canal Edition
Data organization using spreadsheets: Good data organization is the foundation of any research project. Typically, we organize data in spreadsheets in ways that we as humans want to work with the data. In order to use tools that make computation more efficient, such as programming languages like R or Python, we need to structure our data the way that computers need the data. In this lesson, you will learn:
| Jocelyn Swick-Jemison | Workshop |
| 1:00pm | 60 min | Recording - Your Community in Data: Exploring Census Tools and Social Explorer Presentation - Your Community in Data: Exploring Census Tools and Social Explorer
Join us for a hands-on workshop where we’ll unlock insights hidden in U.S. Census data. You’ll learn how to use data.census.gov to find demographic and economic data, then bring those numbers to life with Social Explorer’s interactive maps. Whether you’re curious about local trends, planning a project, or just love data, this session will show you how to turn statistics into a clear picture of your community and beyond. Helpful links Social Explorer: https://research.lib.buffalo.edu/social-explorer | Carolyn Klotzbach-Russell | Workshop |
| Timeslot | Duration | Presentation (Click the Title to Register) | Presenter(s) | Notes |
|---|---|---|---|---|
| 10:00am | 45 min | Recording - Saving the Planet with Data Presentation - Saving the Planet with Data
The University at Buffalo has ambitious goals on climate action. Come learn how it leverages data to drive and communicate its sustainability efforts. This session will explore the tools, metrics, and storytelling strategies that transform complex data into compelling narratives. Learn how UB tracks progress toward climate goals and engages stakeholders through reporting. This workshop offers practical insights into turning numbers into meaningful stories that inspire action. | Derek Nichols | Workshop |
| 11:00am | 60 min | Recording - Data Engineering for AI: Tailoring Open-Source Models for Unique Challenges Presentation - Data Engineering for AI: Tailoring Open-Source Models for Unique Challenges (coming soon)
This session will explore data engineering and data cleaning, focusing on methodologies for creating high-quality datasets to support advanced Large Language Models. Attendees will gain practical skills in dataset development to support model fine-tuning and retrieval-augmented generation, and understand how to build efficient pipelines from raw data to curated datasets. Drawing on best practices and real-world examples, this session is valuable for both experienced data scientists and those interested in improving AI performance through robust dataset development. | Dominic Sellitto | Technical Skill Share |
| 12:00pm | 60 min | Recording - Data Cleaning Using OpenRefine: Love Canal Edition Presentation - Data Cleaning Using OpenRefine: Love Canal Edition (coming soon)
| Jocelyn Swick-Jemison | Workshop |
| 1:00pm | 60 min | Recording - Visualizing the Love Canal Timeline Presentation - Visualizing the Love Canal Timeline
Come learn about the Love Canal chronology while making a visually compelling timeline. You'll get to use materials from the collection to make a timeline with TimelineJS. We'll also cover best practices for managing media data, storytelling planning, and more. | Natalia Estrada | Workshop |
| Timeslot | Duration | Presentation (Click the Title to Register) | Presenter(s) | Notes |
|---|---|---|---|---|
| 10:00am | 45 min | Recording - UB’s Enterprise Data Strategy Focus Presentation -UB's Enterprise Data Strategy Focus
Over 10 years ago UB began a data governance journey to align strategy, define objectives, and establish policies surrounding enterprise information. The current enterprise data strategy initiative seeks to apply the lessons learned from data governance to support expanded information access, streamline process, and modernize the infrastructure supporting campus data management. This presentation focuses on potential improvements to requesting campus information and modernizing our information toolsets that are part of this effort. | Presentation | |
| 11:00am | 60 min | Recording - Using Data to Understand Ship Breaking Practices (Additional Information) Presentation - Using Data to Understand Ship Breaking Practices
Ship breaking is the practice of dismantling ships at end of life. This is typically an environmentally harmful practice and dangerous to the workers who perform it. Learn about this industry and how the NGO Shipbreaking Platform tracks companies that skirt legal conventions to illegally dismantle vessels. You will also learn about Databricks, a state-of-the-art data analytics platform, used here as the vehicle to perform the analysis.
If you wish to participate in the interactive portion of the event:
| Justin Del Vecchio | Interactive Demo with Databricks |
| 12:00pm | 60 min | Recording - Simple Data Analysis and Visualization in PowerBI: Love Canal Edition Presentation - Simple Data Analysis and Visualization in PowerBI: Love Canal Edition
Now that you have collected and cleaned up your data, how do we use it to answer our research questions? PowerBI is a robust tool within Microsoft365 that can be used to explore, analyze and visualize your data all in one place. This introductory workshop will use the web version of PowerBI to upload a dataset and create a simple visualization to really make your data shine. | Jocelyn Swick-Jemison | Workshop |
| 2:00pm | 60 min | Recording - Open Research and Contributor IDs (ORCID) Presentation - Open Research and Contributor IDs (ORCID)
In this workshop we will walk through how to create an ORCID, reasons why using an ORCID matters, and how to connect your ORCID to some of the major systems that can update ORCID records. | Scott Peterson | Workshop |
| 3:00pm | 60 min | Recording - LoveDataWeek: Love at First Measure - How Two SUNY Flagships Do Assessment Presentation - LoveDataWeek: Love at First Measure - How Two SUNY Flagships Do Assessment
This panel brings together assessment leaders from two SUNY flagship institutions to explore how assessment is structured and supported on each campus, including where assessment offices sit within the organization and how the work is carried out. Panelists will then highlight applied examples of assessment in practice, such as data collected through general education assessment or other projects, with a focus on the implementation of the new civil discourse student learning outcome. The session will conclude with time for audience questions and discussion. | University at Buffalo / StonyBrook Joint Presentation |
| Timeslot | Duration | Presentation (Click the Title to Register) | Presenter(s) | Notes |
|---|---|---|---|---|
| 11:00am | 60 min | Recording - The Long Haul: Best Practices for Making Your Digital Project Last Presentation - The Long Haul: Best Practices for Making Your Digital Project Last
You've invested a lot of work in creating a digital project, but how do you ensure it has staying power? We'll look at choices you can make at the beginning of project development to influence sustainability, best practices for documentation and asset management, and how to sunset your project in a way that ensures long-term access for future researchers. | Workshop | |
| 12:00pm | 60 min | Recording - Mapping Your Community: Geospatial Data with Google Earth Presentation - Mapping Your Community: Geospatial Data with Google Earth Geospatial - Additional Materials
Discover how to visualize and analyze location-based data in this hands-on workshop. Using Google Earth, you will learn fundamental GIS concepts that include layering spatial data, creating custom maps, and exploring geographic patterns. No prior experience is needed - attendees will need a Google account to follow along. | Sam Kim | Workshop |
| 1:00pm | 50 min | Recording - The Human Side of Numbers - How Stories Make Data Matter Presentation - The Human Side of Numbers - How Stories Make Data Matter
In a world increasingly driven by dashboards, metrics, and algorithms, the ability to make meaning from data has never been more essential. This session explores how storytelling—long a core strength of the humanities—can transform data from static numbers into narratives that inform, persuade, and inspire action. Participants will gain insight into the unique value that humanities scholars bring to data-centered work, from critical thinking and audience awareness to ethical reasoning and cultural analysis. This interactive session will highlight emerging career paths at the intersection of data and the humanities—including data communication, visualization, UX research, digital scholarship, and research outreach—and offer practical strategies for helping students connect their storytelling skills to data-driven roles. Join us to explore why data needs storytellers, and how UB’s humanities community can play a powerful role in shaping meaningful, responsible data narratives. | Holly Justice | Career Design Center |
| 2:00pm | 30 min | Recording - Managing Qualitative Responses with Smart AI Prompting Presentation - Managing Qualitative Responses with Smart AI Prompting
| Mary Odden | Office of Accreditation and Quality Improvement |
| 3:00pm | 90 min | Recording - Data Justice for Food Justice Presentation - Data Justice for Food Justice
| UB Food Lab Project | Workshop |
In-Person Events - Friday Feb 13 (Day 5)
In-person events will be held in 145 Student Union from 10:30am to 12pm.
Limited seating is available, reserve your spot today.

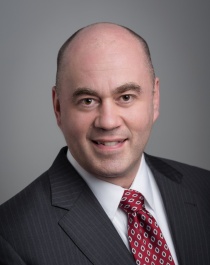
Craig W. Abbey
Craig W. Abbey
Vice Provost for Institutional Analysis and Planning
Craig Abbey started working at the University at Buffalo in 2009 and became head of the Office of Institutional Analysis in 2010. Craig’s current title is Vice Provost for Institutional Analysis and Planning. The office has the primary institutional responsibility for reporting and analytic support for the planning, evaluation and policy initiatives of the Provost and other senior university leaders. Craig also serves as UB’s Accreditation Liaison Officer to the Middle States Commission on Higher Education.
Prior to joining UB he served as Assistant Provost of Policy and Planning and Chief Data Officer of the SUNY System. Before working in higher education, Craig was a social policy analyst for the Congressional Research Service, which works exclusively for the United States Congress, providing policy and legal analysis to the House and Senate. He also served as a staff economist for the New York State Assembly’s Ways and Means Committee after 9/11.

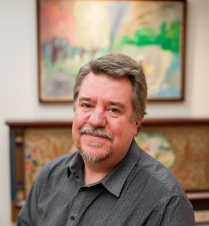
Jake Carlson
The Realities of Academic Data Sharing: Understanding the Costs of the Federal Data Sharing Requirements
Jake Carlson (ORCID 0000-0003-2733-0969) is the Associate University Librarian for Research, Collections and Outreach at the University at Buffalo (UB) Libraries. His research centers on developing and supporting services to publish materials of scholarly value that do not have a home in traditional publication structures, research data in particular, in ways that follow FAIR and ethical practices. Carlson has authored or co-authored more than 35 publications on research data services and repositories in libraries. His work has been supported by funding from the National Institutes of Health, the National Science Foundation (NSF), the Alfred P. Sloan Foundation, and the Institute for Museum and Library Services (IMLS).


Provost A. Scott Weber
A. Scott Weber
Provost and Executive Vice President for Academic Affairs
A. Scott Weber serves as UB’s chief academic officer, providing leadership across the academic enterprise including research, scholarship and creative activities; undergraduate, graduate, professional and international education; faculty development; inclusive excellence initiatives; and university libraries. Weber is leading the implementation of UB’s vision to be recognized among the nation’s top public research universities, focused on building on UB’s strengths to achieve new levels of excellence in research, scholarship, education, clinical care, and engagement. A member of UB’s faculty since 1983, Weber is an innovative scholar and teacher and former chair of UB’s Department of Civil, Structural and Environmental Engineering.
- Jim Gorman, Assistant Director, Enterprise Application Services
- Holly A. Klick, Research Analyst, Office of Institutional Analysis
- Jordan Knutsen, Assistant for Institutional Research, Office of Institutional Analysis
- Patrick McDonald, PhD, Assistant Dean for Planning and Analytics, College of Arts and Sciences
- Erin K. O’Brien, PhD, UB Chief Student Retention Officer, Undergraduate Education, Student Life
- Thomas Okon, Assistant Vice President, Business Reporting and Systems
- Joe Rizzo, Associate Registrar, Office of the Registrar
- Smita Samanta, PhD, Director of Undergraduate Research, College of Arts and Sciences
- Jocelyn Swick-Jemison, Data Services Librarian, Abbott Library
- Rob Wright, Assistant Director, Enterprise Application Services
For questions or how to get involved, contact
Jordan Knutsen
jknutsen@buffalo.edu
Love Data Week is brought to you by OIA in collaboration with the University Libraries Research Data Services Department