News & information from UB, New York's flagship university
Massive study provides detailed look at how Greenland’s ice is vanishing
The new research suggests that the Greenland Ice Sheet may lose ice more rapidly in the near future than previously thought
Release Date: December 15, 2014 This content is archived.
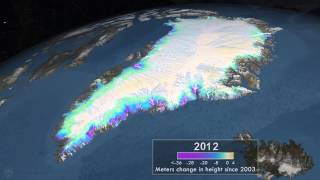


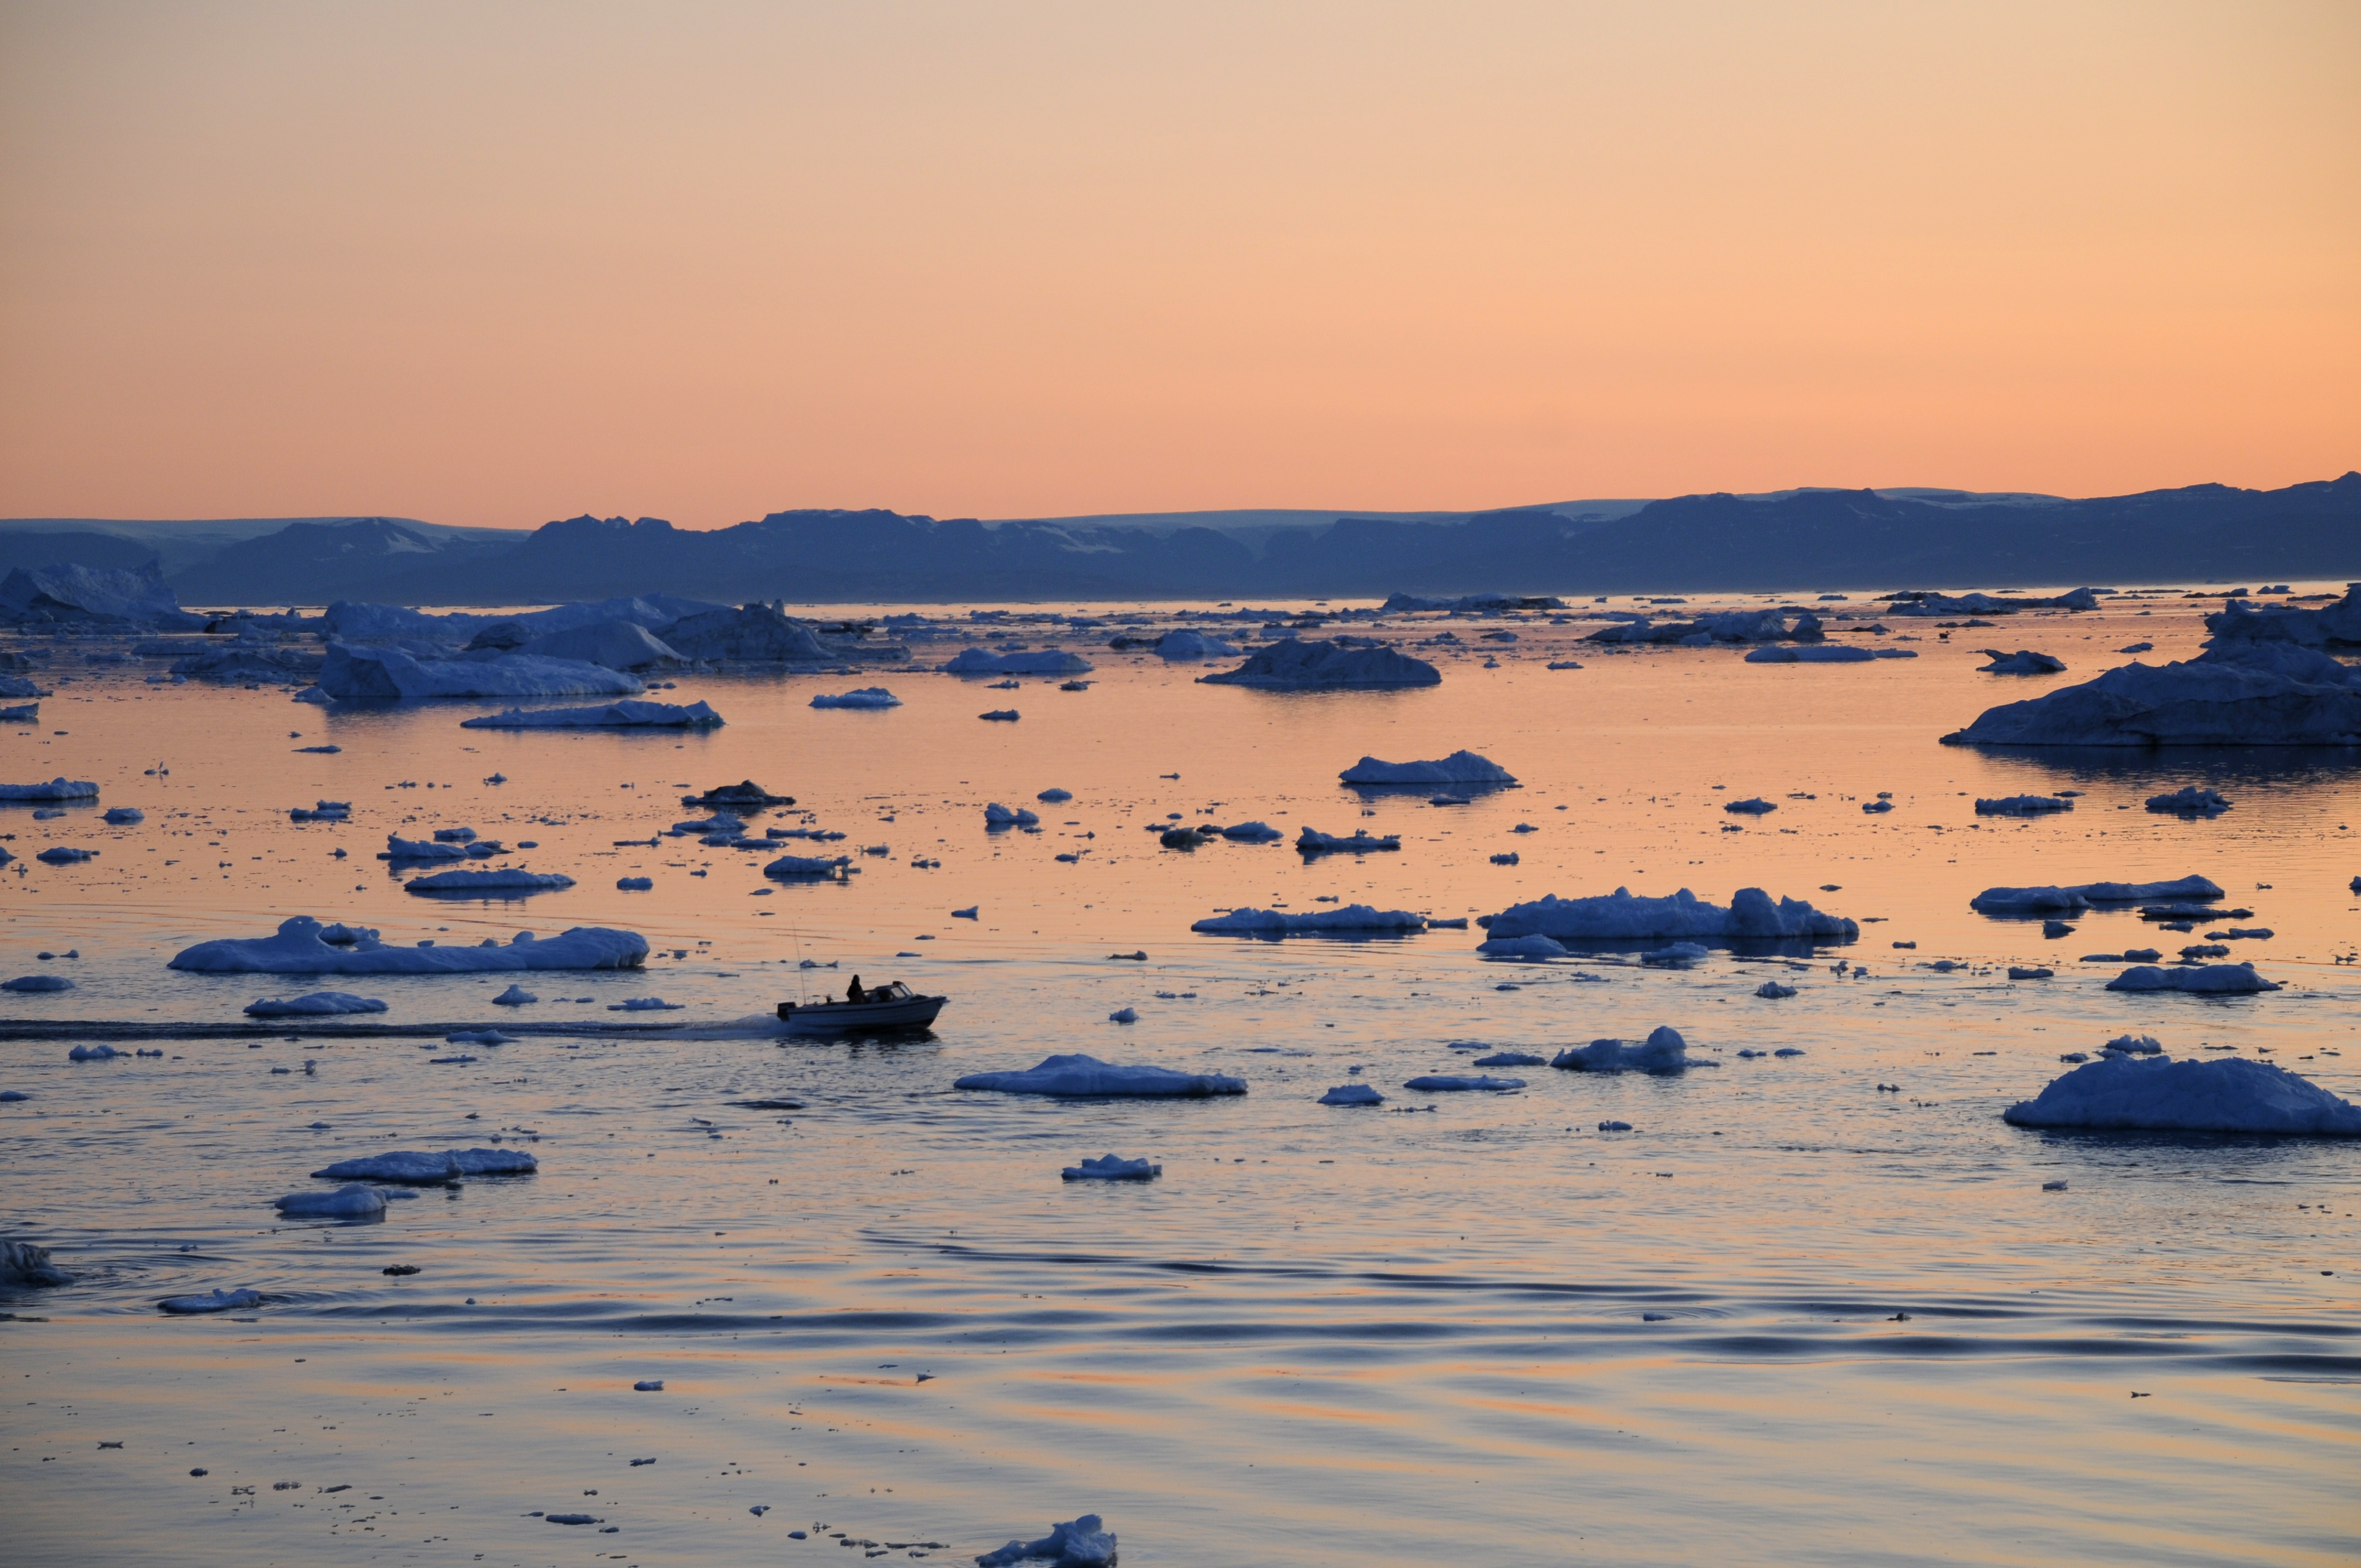
BUFFALO, N.Y. — The Greenland Ice Sheet is the second-largest body of ice on Earth.
It covers an area about five times the size of New York State and Kansas combined, and if it melts completely, oceans could rise by 20 feet. Coastal communities from Florida to Bangladesh would suffer extensive damage.
Now, a new study is revealing just how little we understand this northern behemoth.
Led by geophysicist Beata Csatho, PhD, an associate professor of geology at the University at Buffalo, the research provides what the authors think is the first comprehensive picture of how Greenland’s ice is vanishing.
It suggests that current ice sheet modeling studies are too simplistic to accurately predict the future contributions of the entire Greenland Ice Sheet to sea level rise, and that Greenland may lose ice more rapidly in the near future than previously thought.
“The great importance of our data is that for the first time, we have a comprehensive picture of how all of Greenland’s glaciers have changed over the past decade,” Csatho says.
“This information is crucial for developing and validating numerical models that predict how the ice sheet may change and contribute to global sea level over the next few hundred years,” says Cornelis J. van der Veen, PhD, professor in the Department of Geography at the University of Kansas, who played a key role in interpreting glaciological changes.
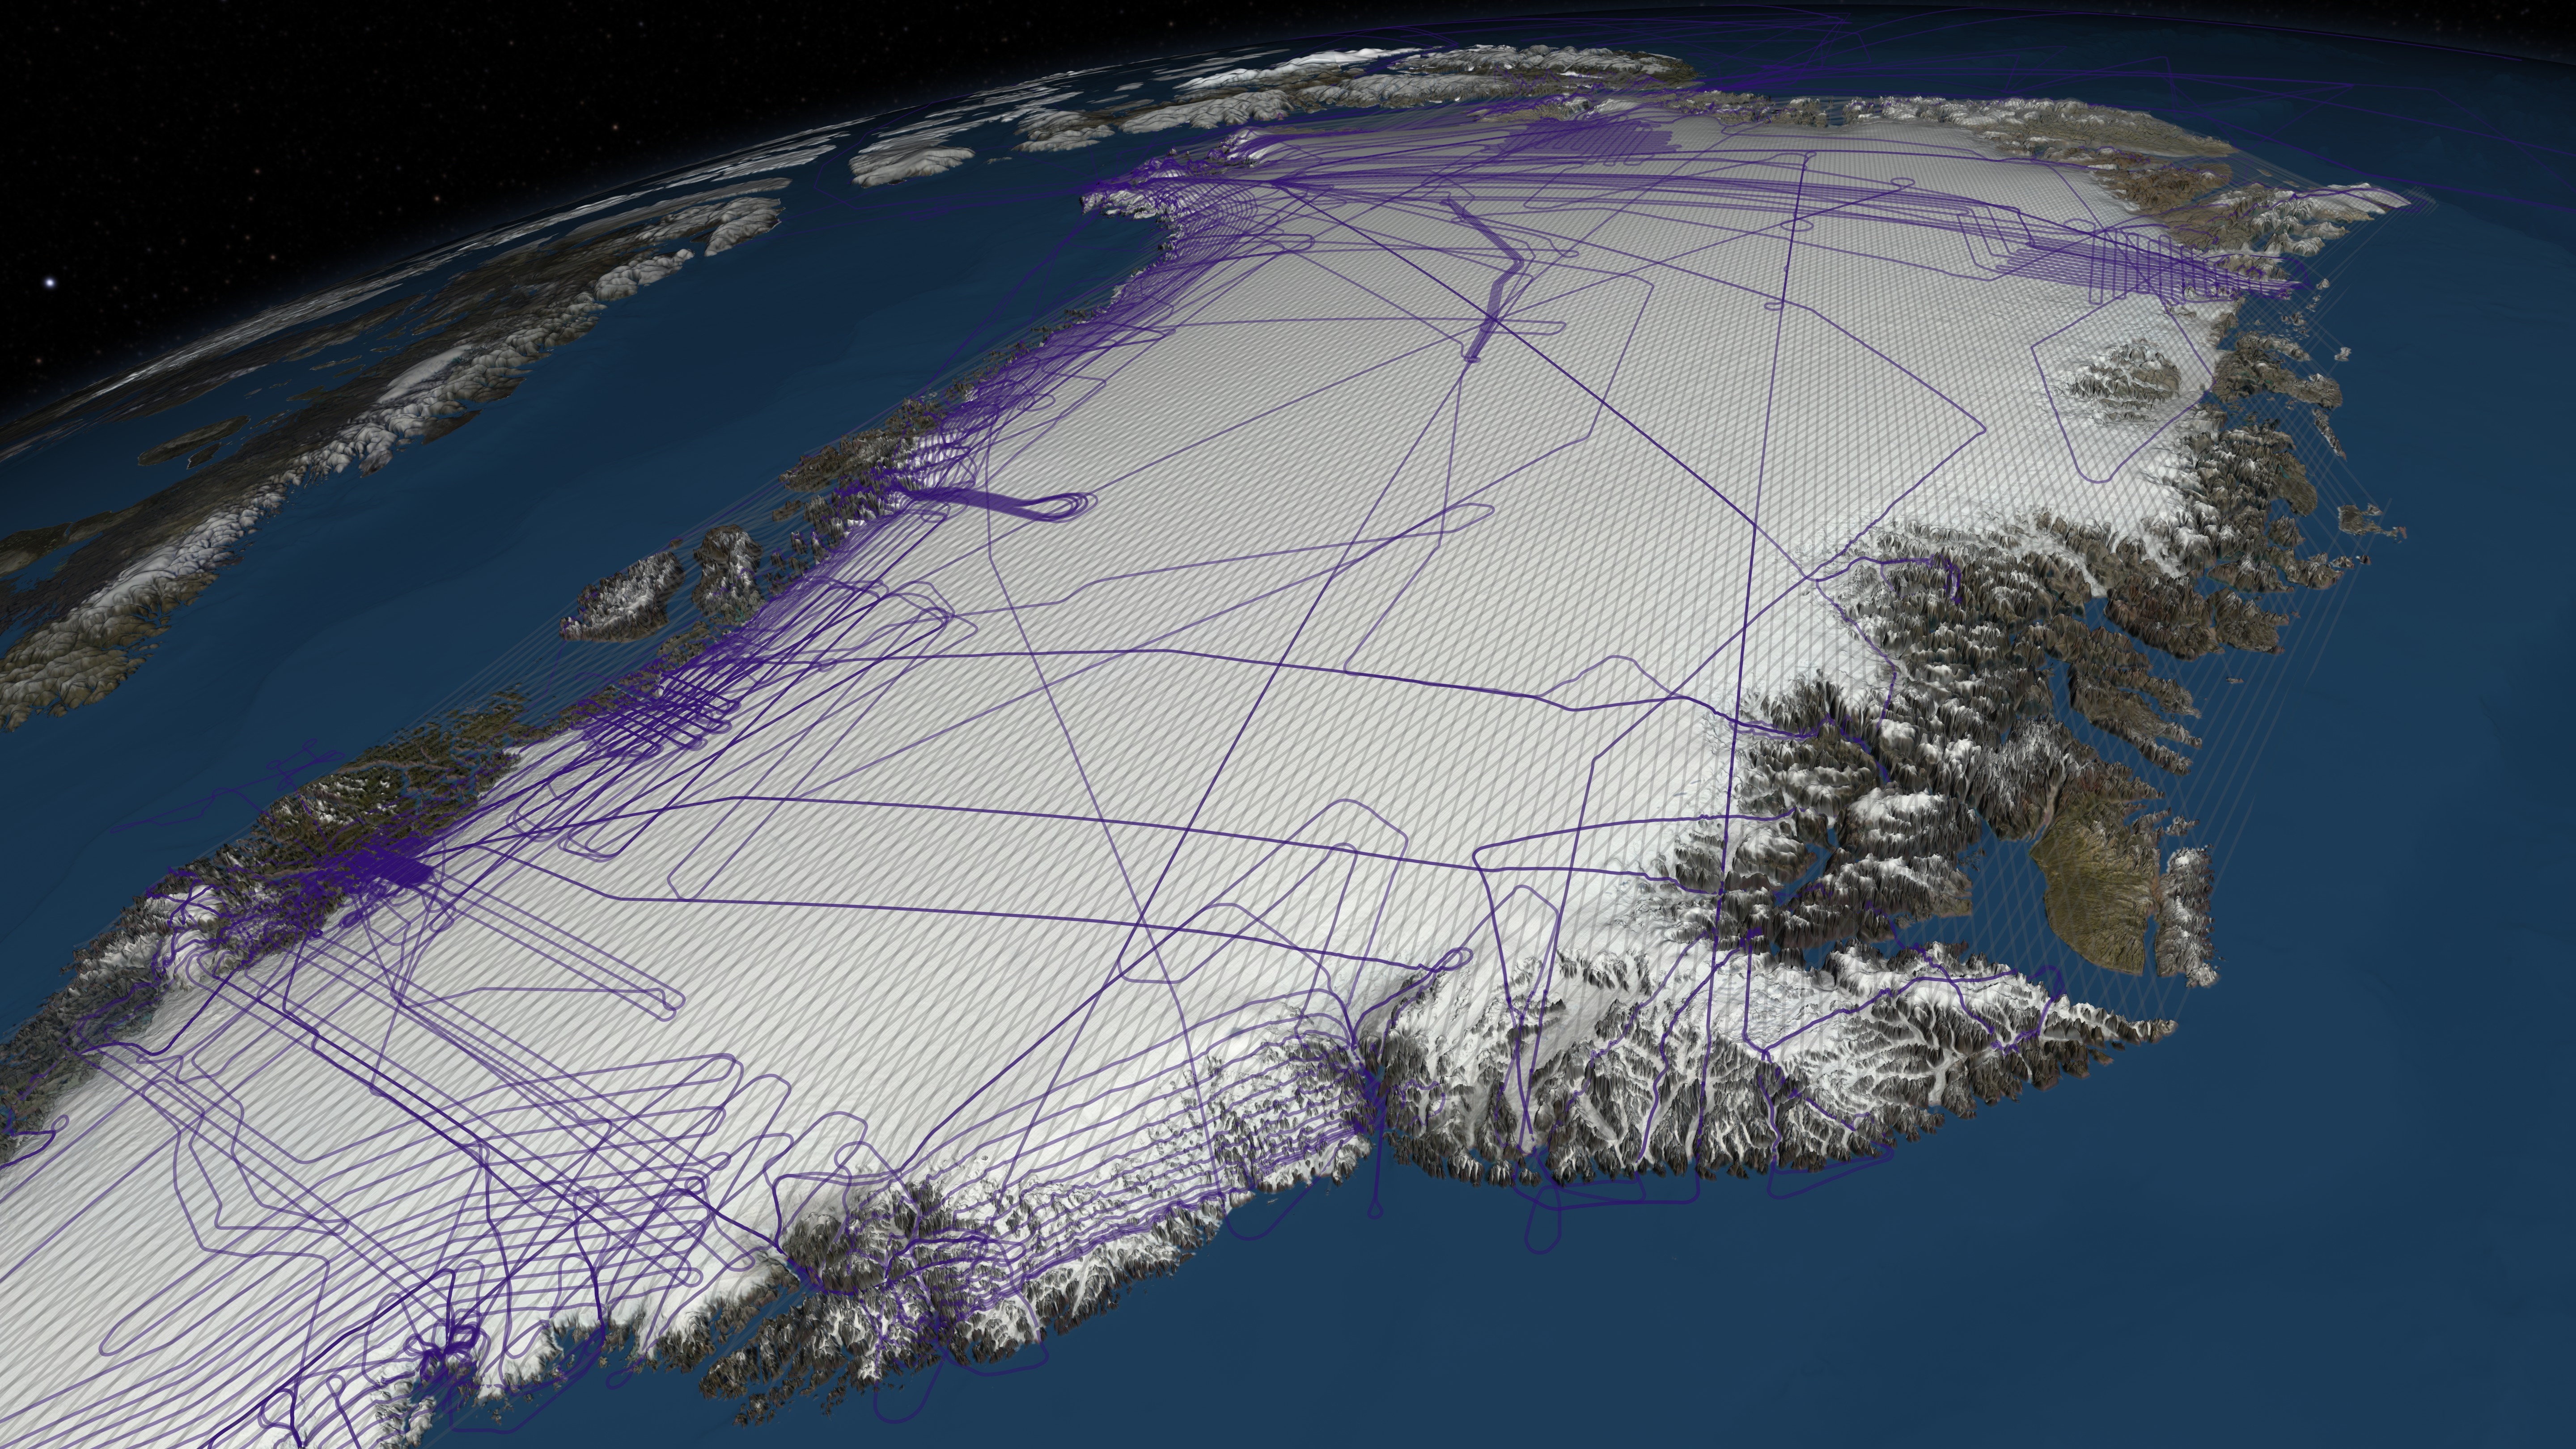
The project was a massive undertaking, using satellite and aerial data from NASA’s ICESat spacecraft and Operation IceBridge field campaign to reconstruct how the height of the Greenland Ice Sheet changed at nearly 100,000 locations from 1993 to 2012.
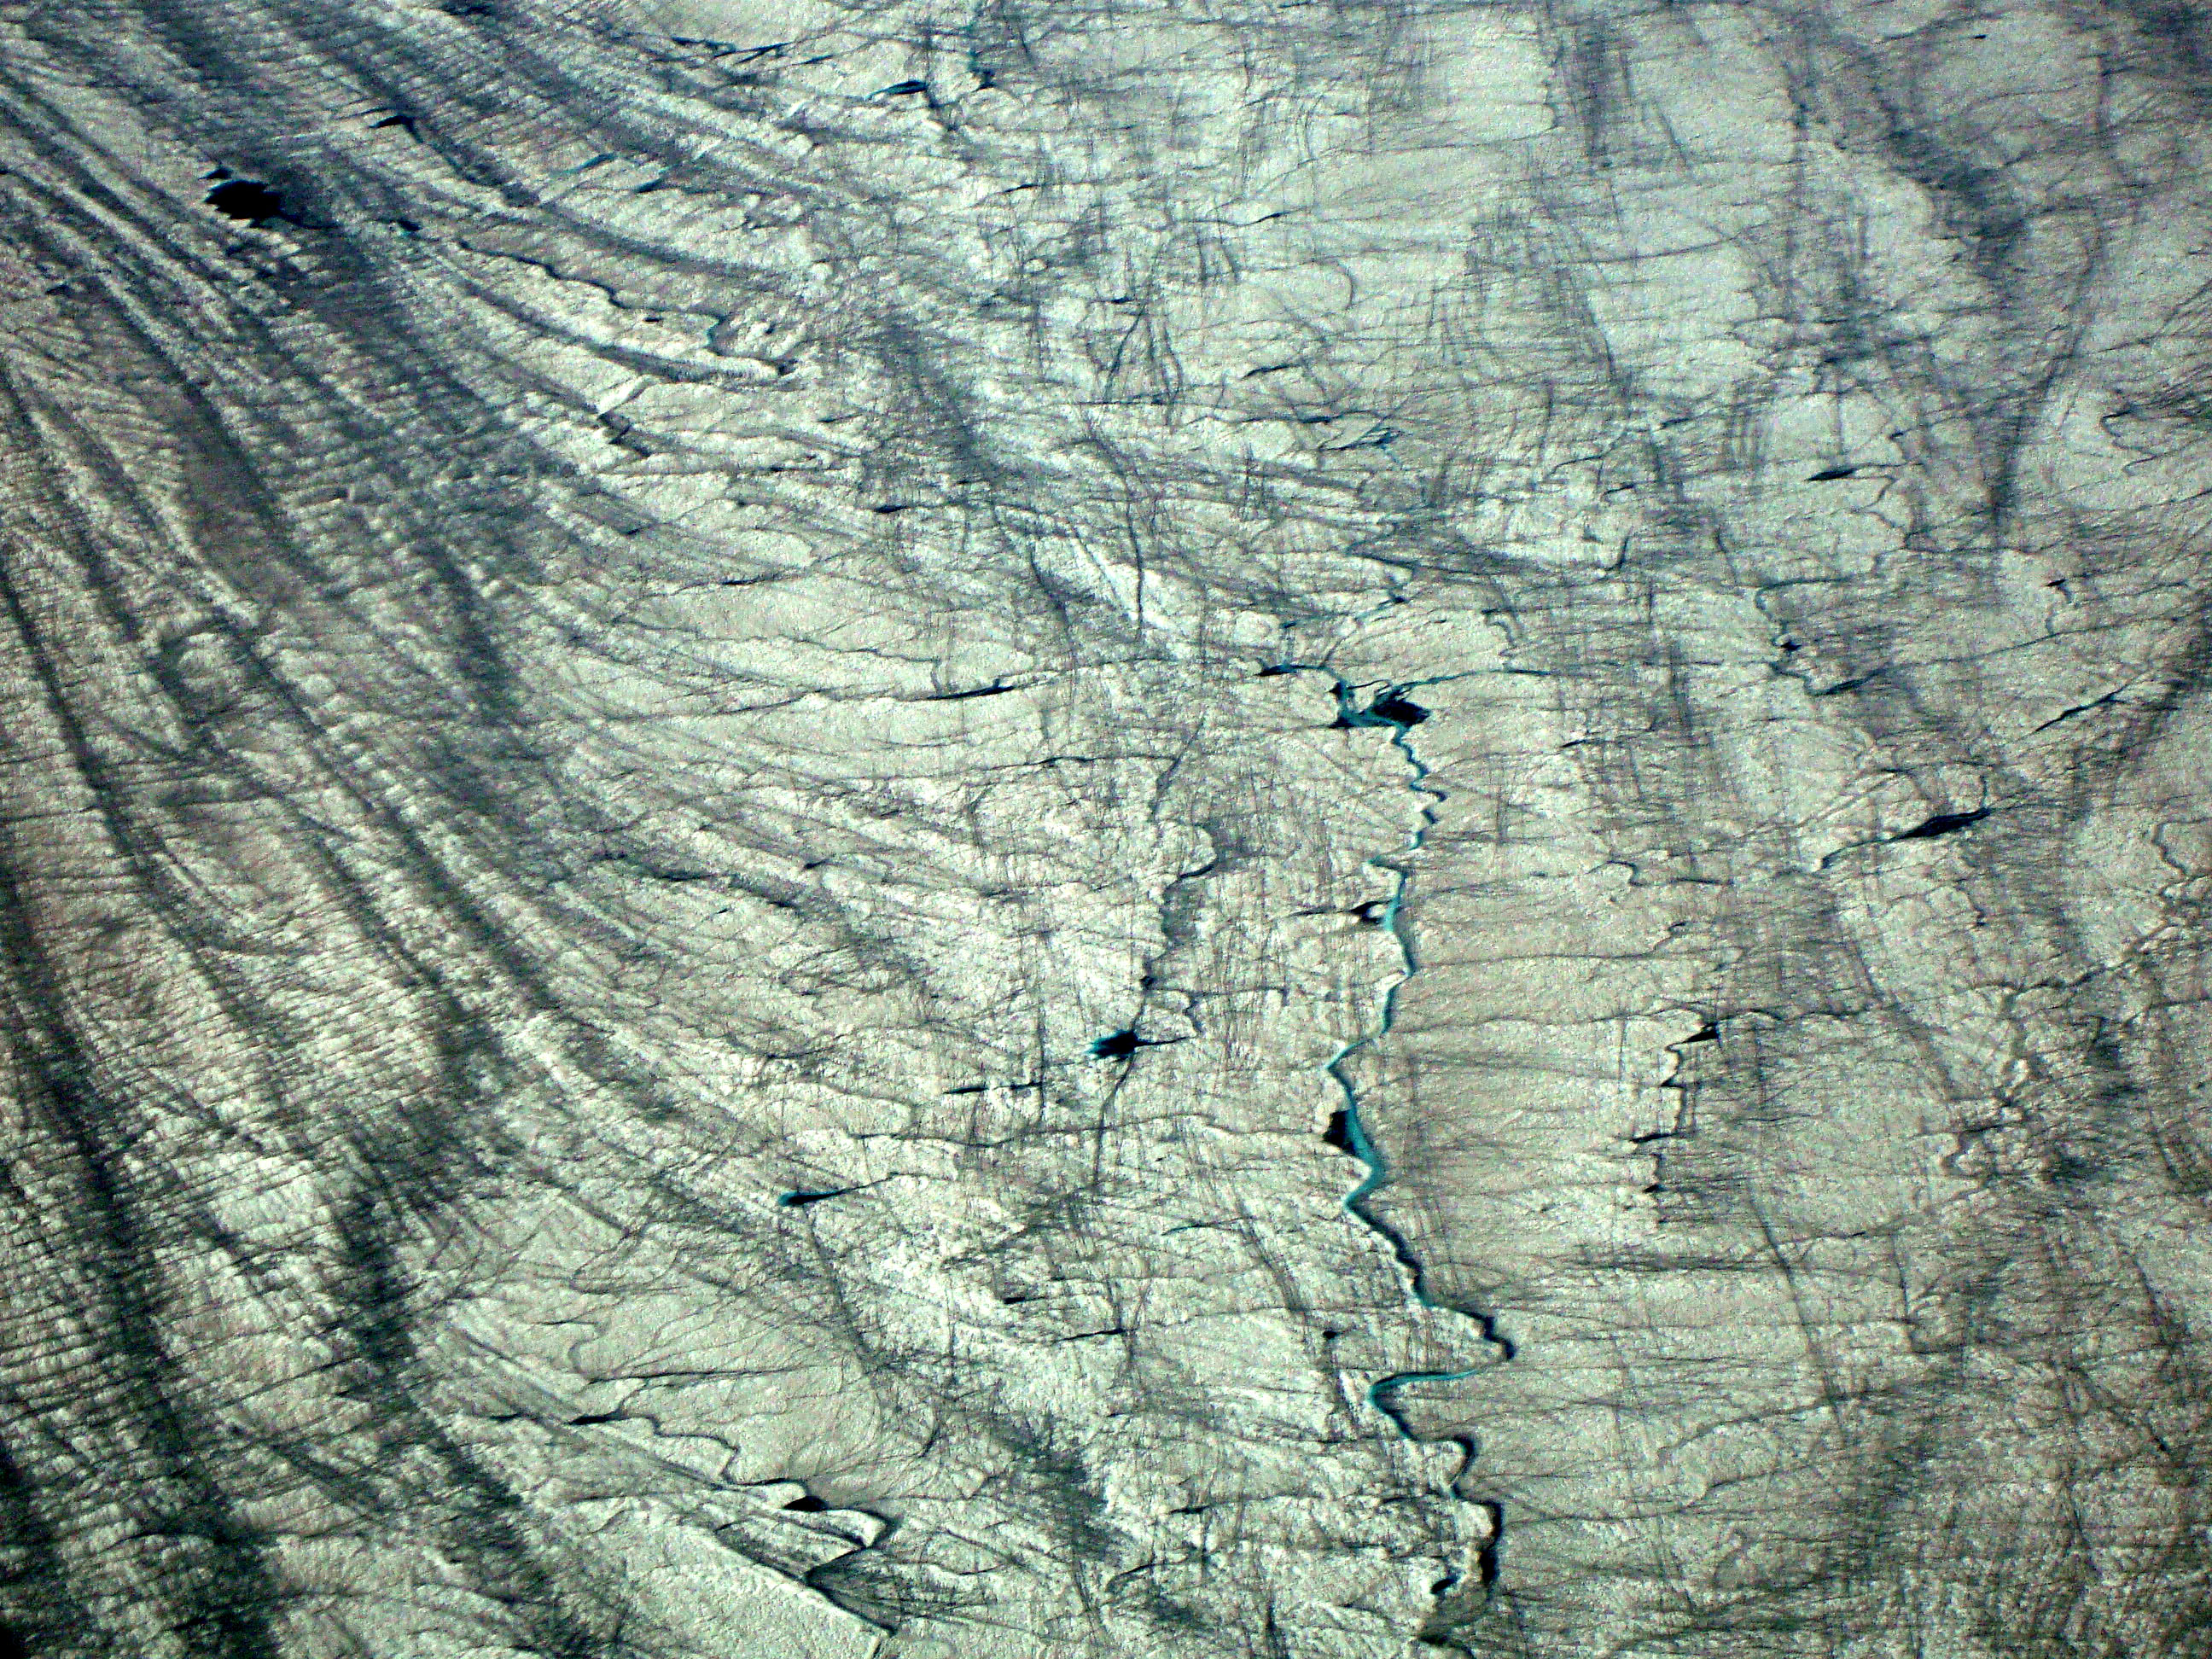
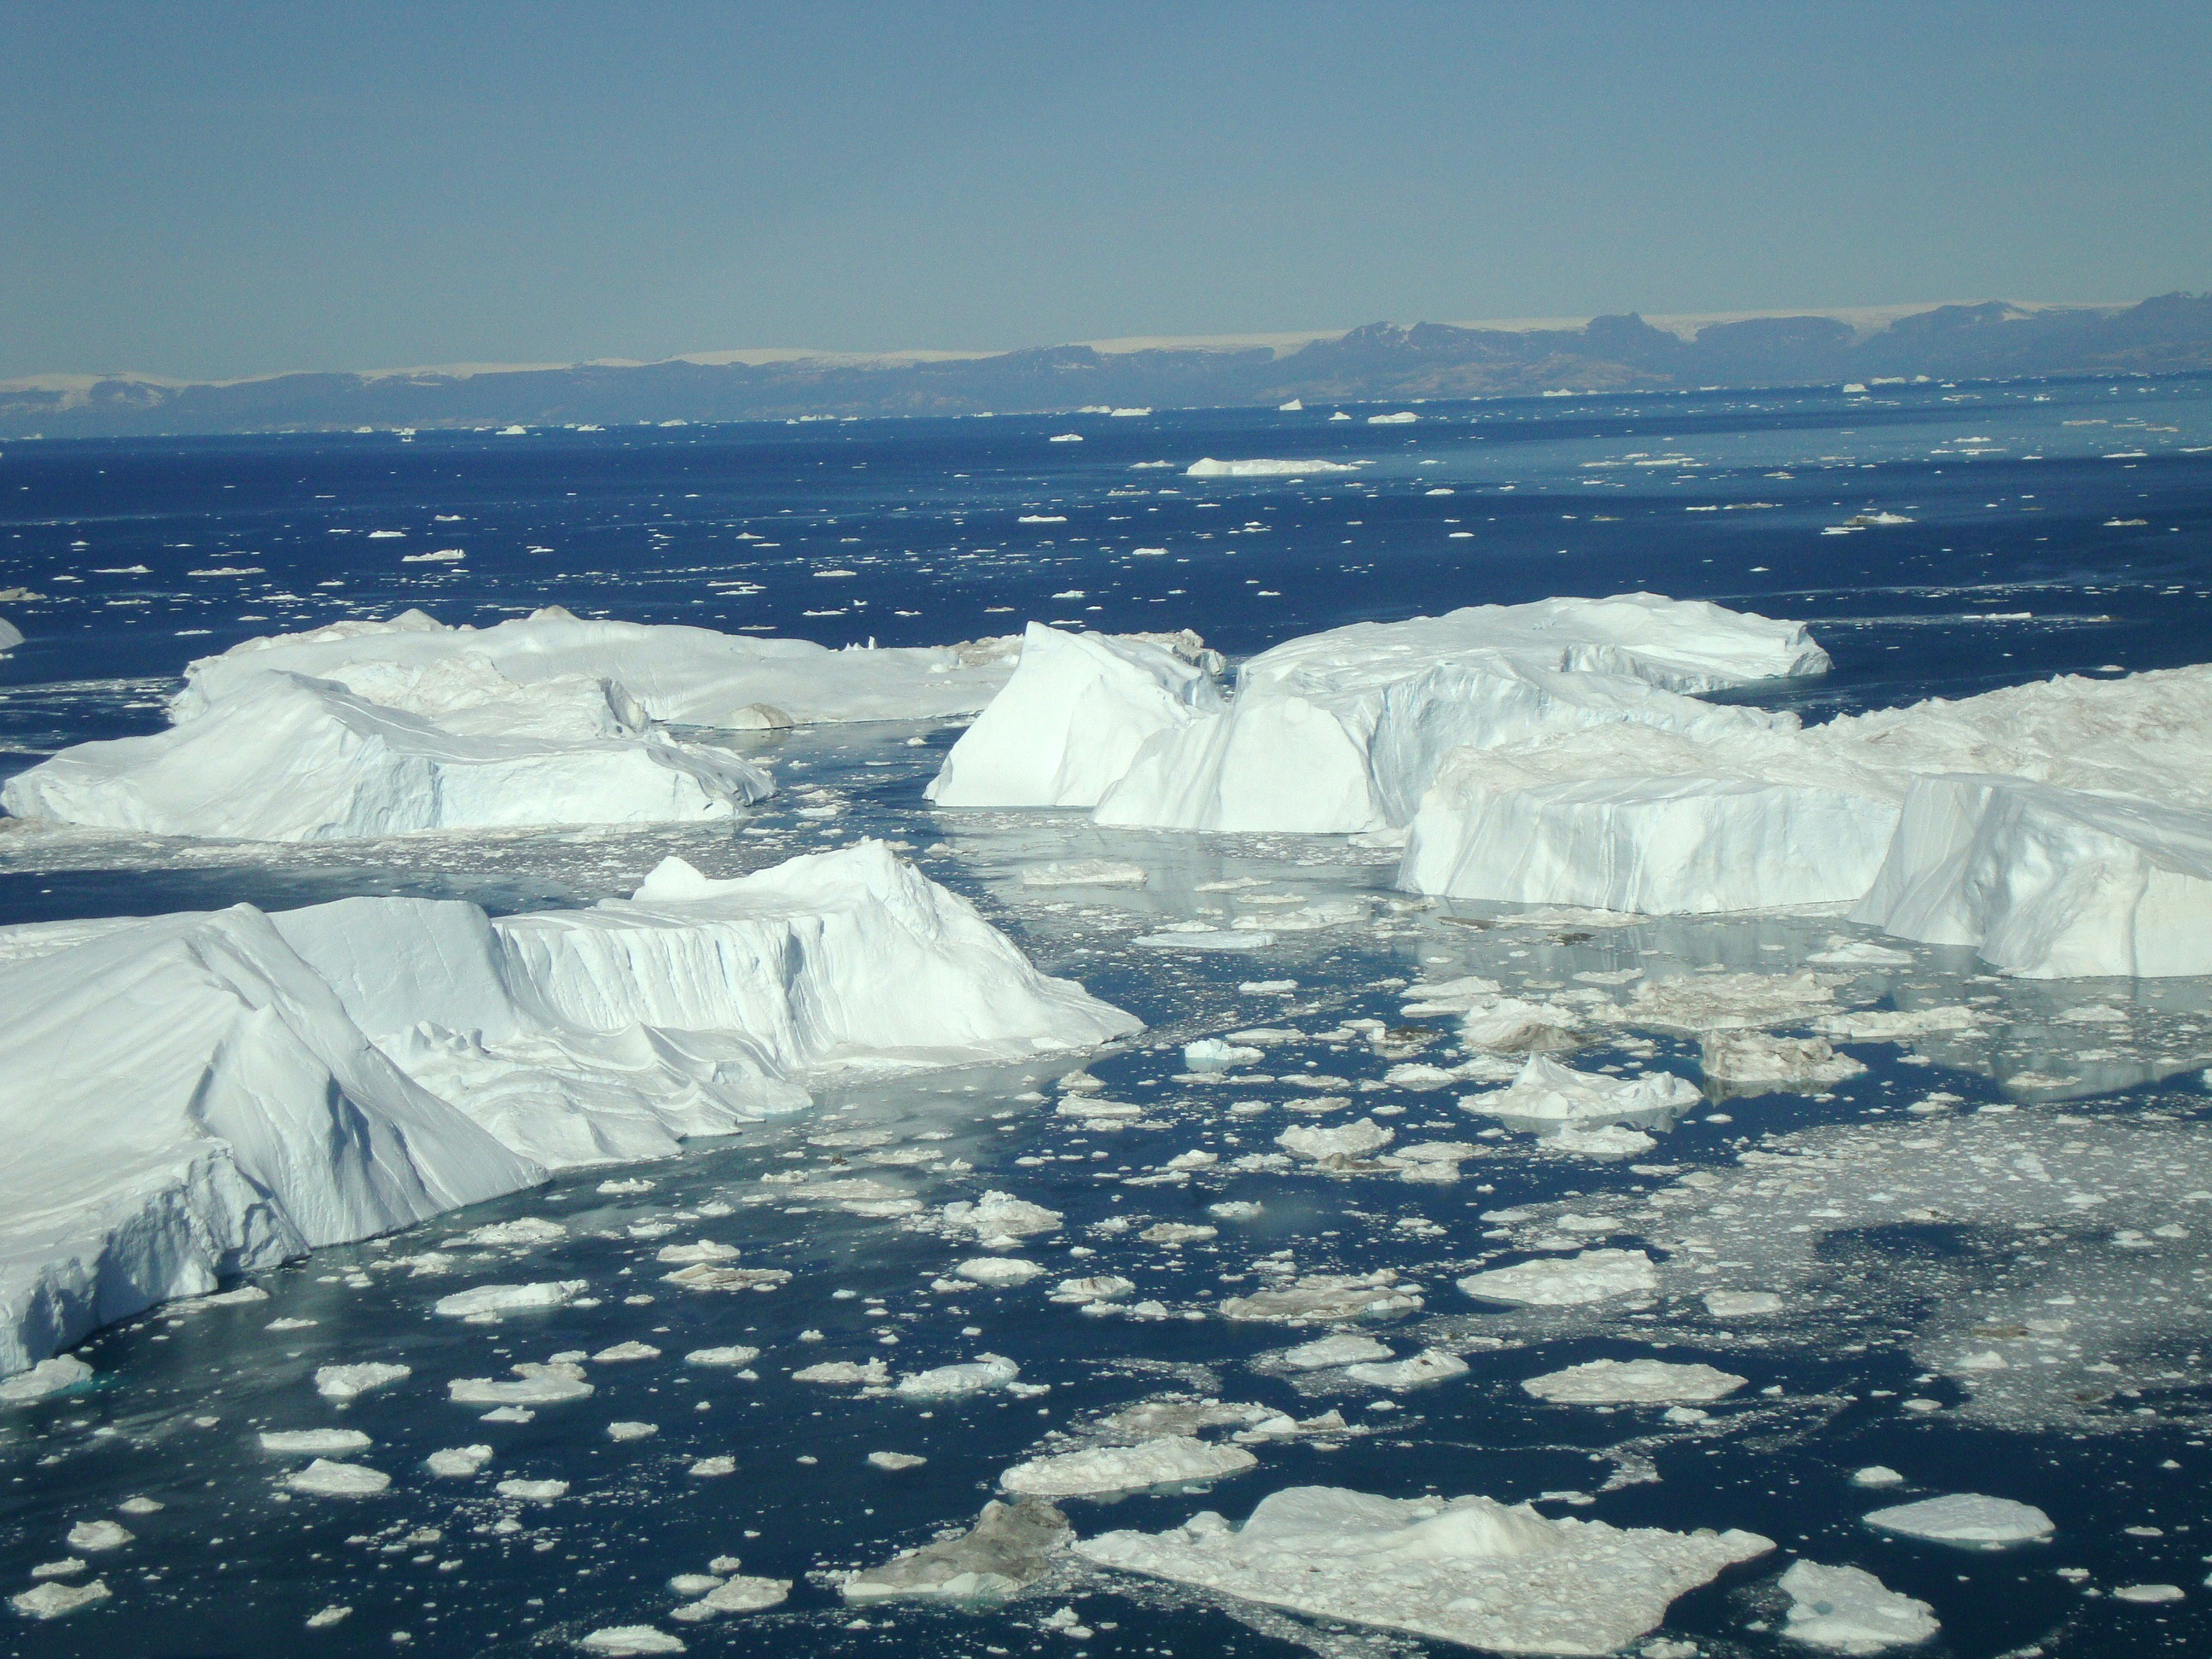
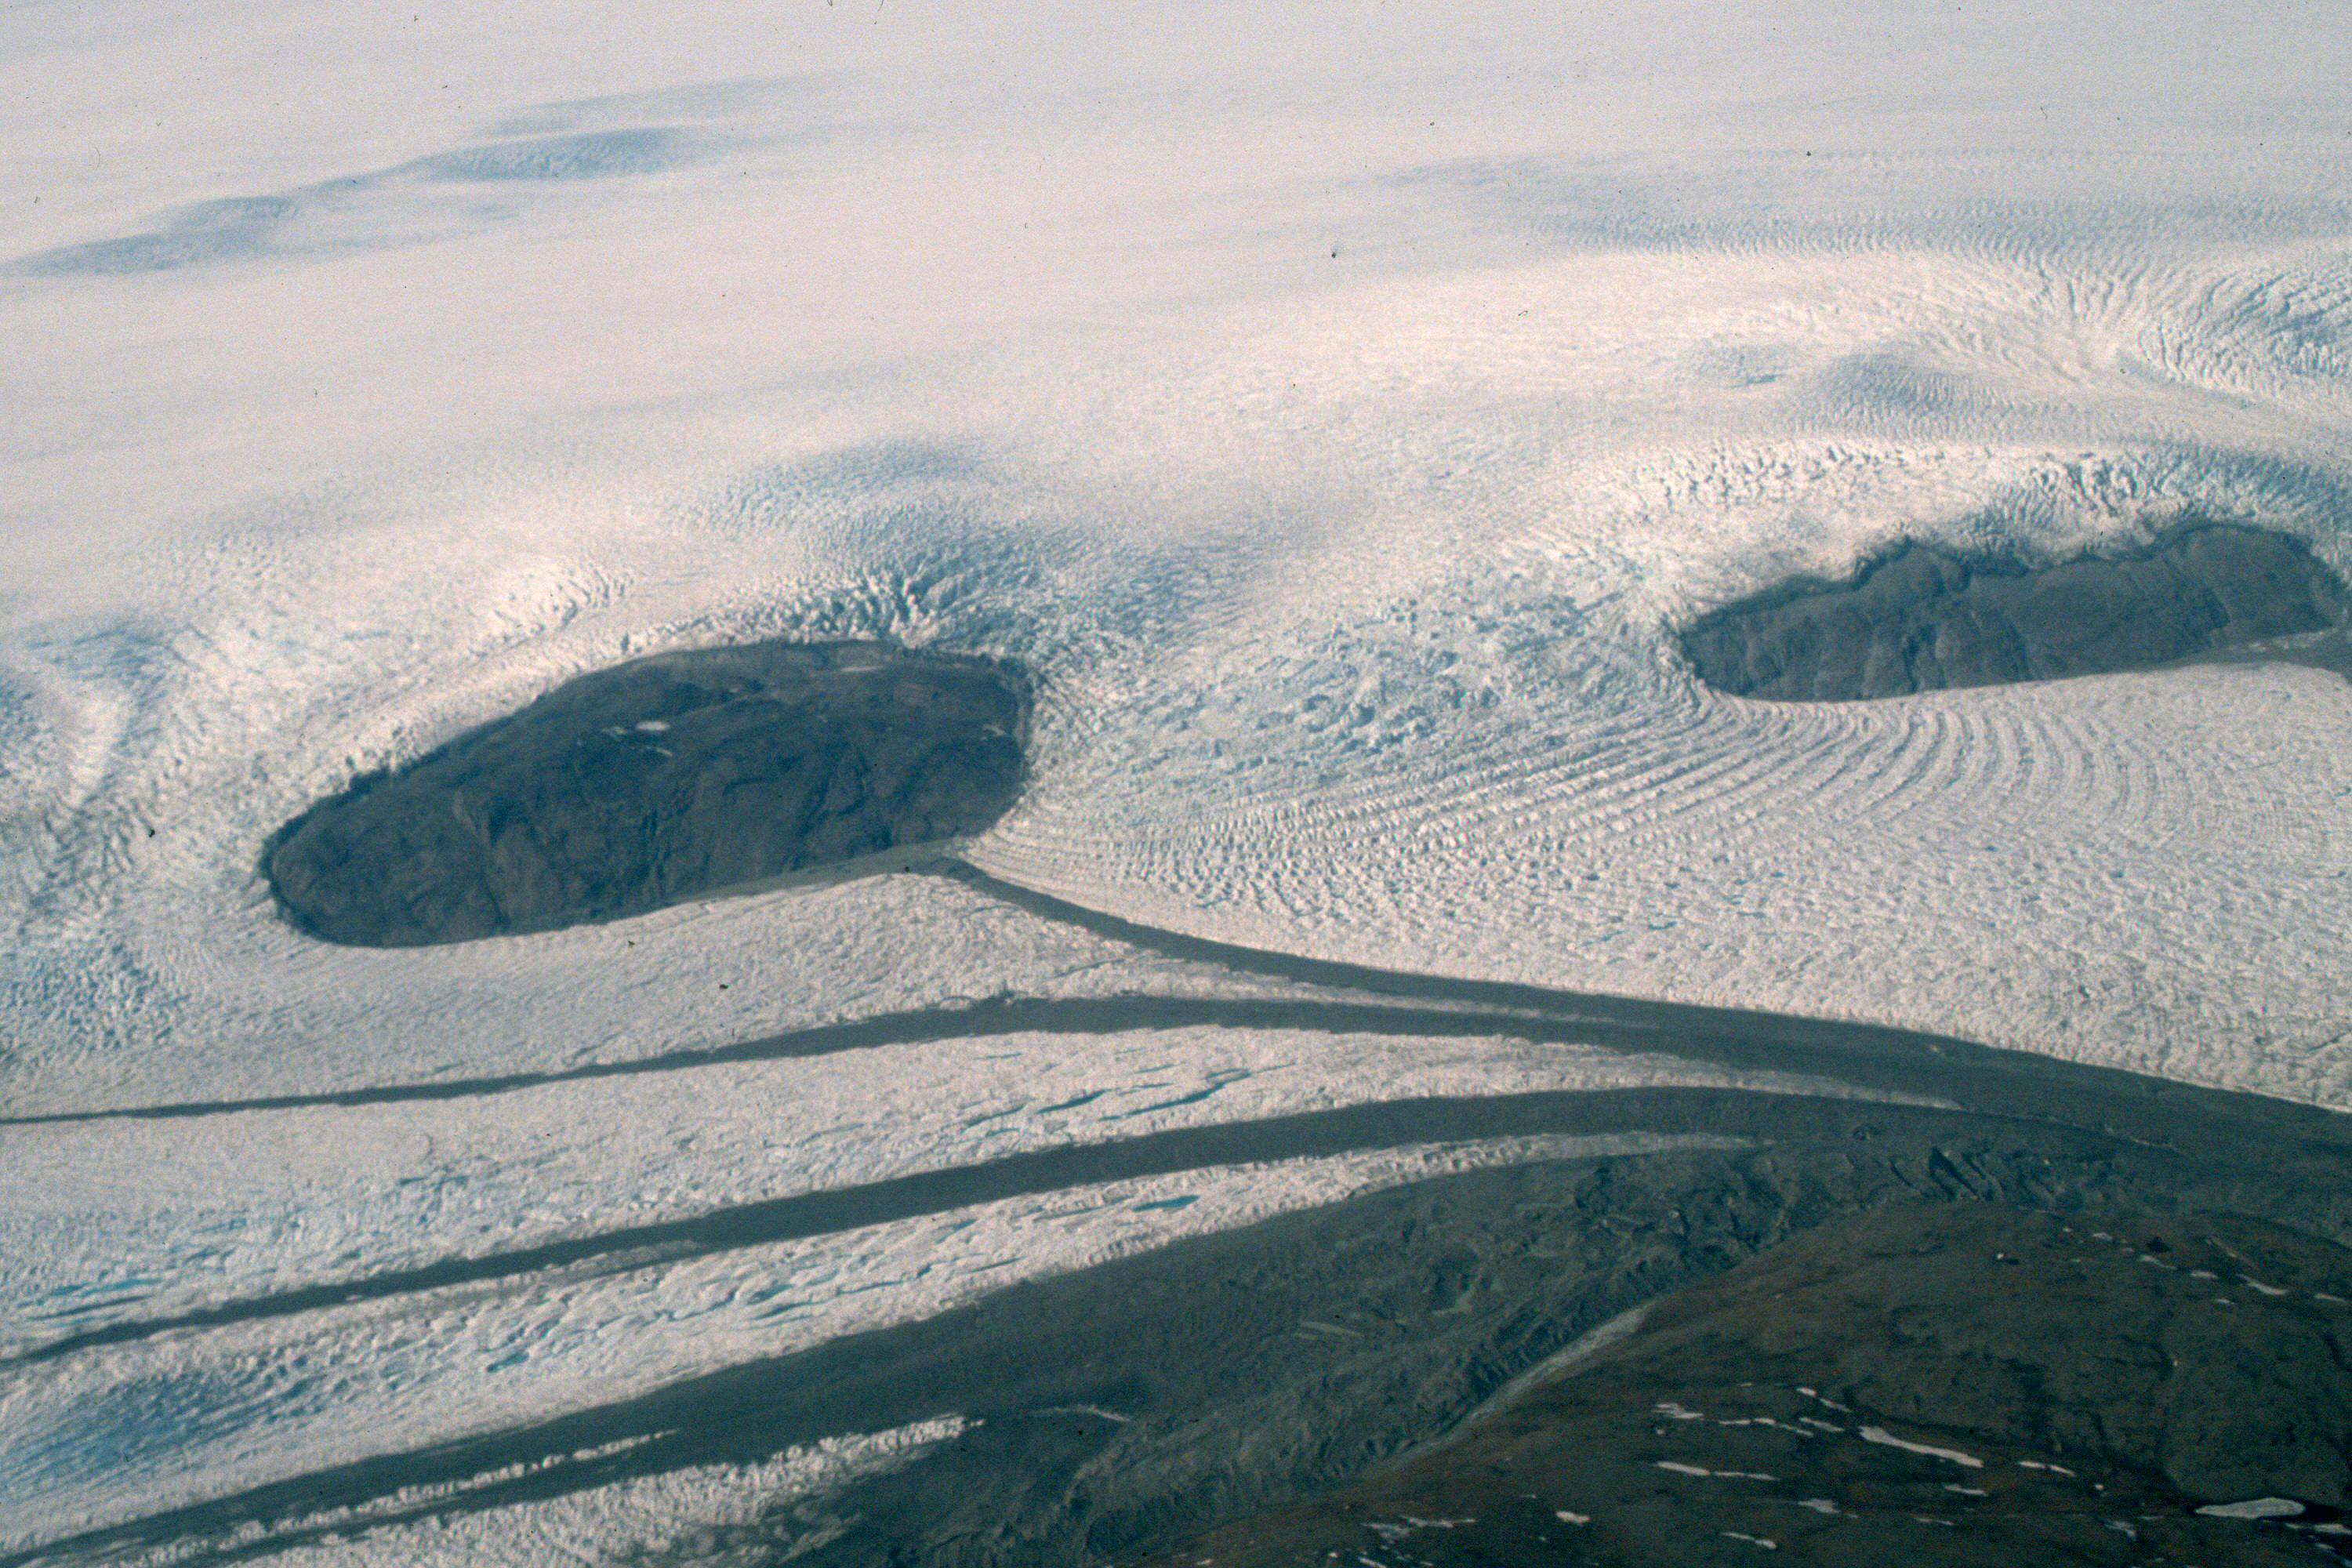
Ice loss takes place in a complex manner, with the ice sheet both melting and calving ice into the ocean.
The study had two major findings:
- First, the scientists were able to provide new estimates of annual ice loss at high spatial resolution (see below).
- Second, the research revealed that current models fail to accurately capture how the entire Greenland Ice Sheet is changing and contributing to rising oceans.
The second point is crucial to climate change modelers.
Today’s simulations use the activity of four well-studied glaciers — Jakobshavn, Helheim, Kangerlussuaq and Petermann — to forecast how the entire ice sheet will dump ice into the oceans.
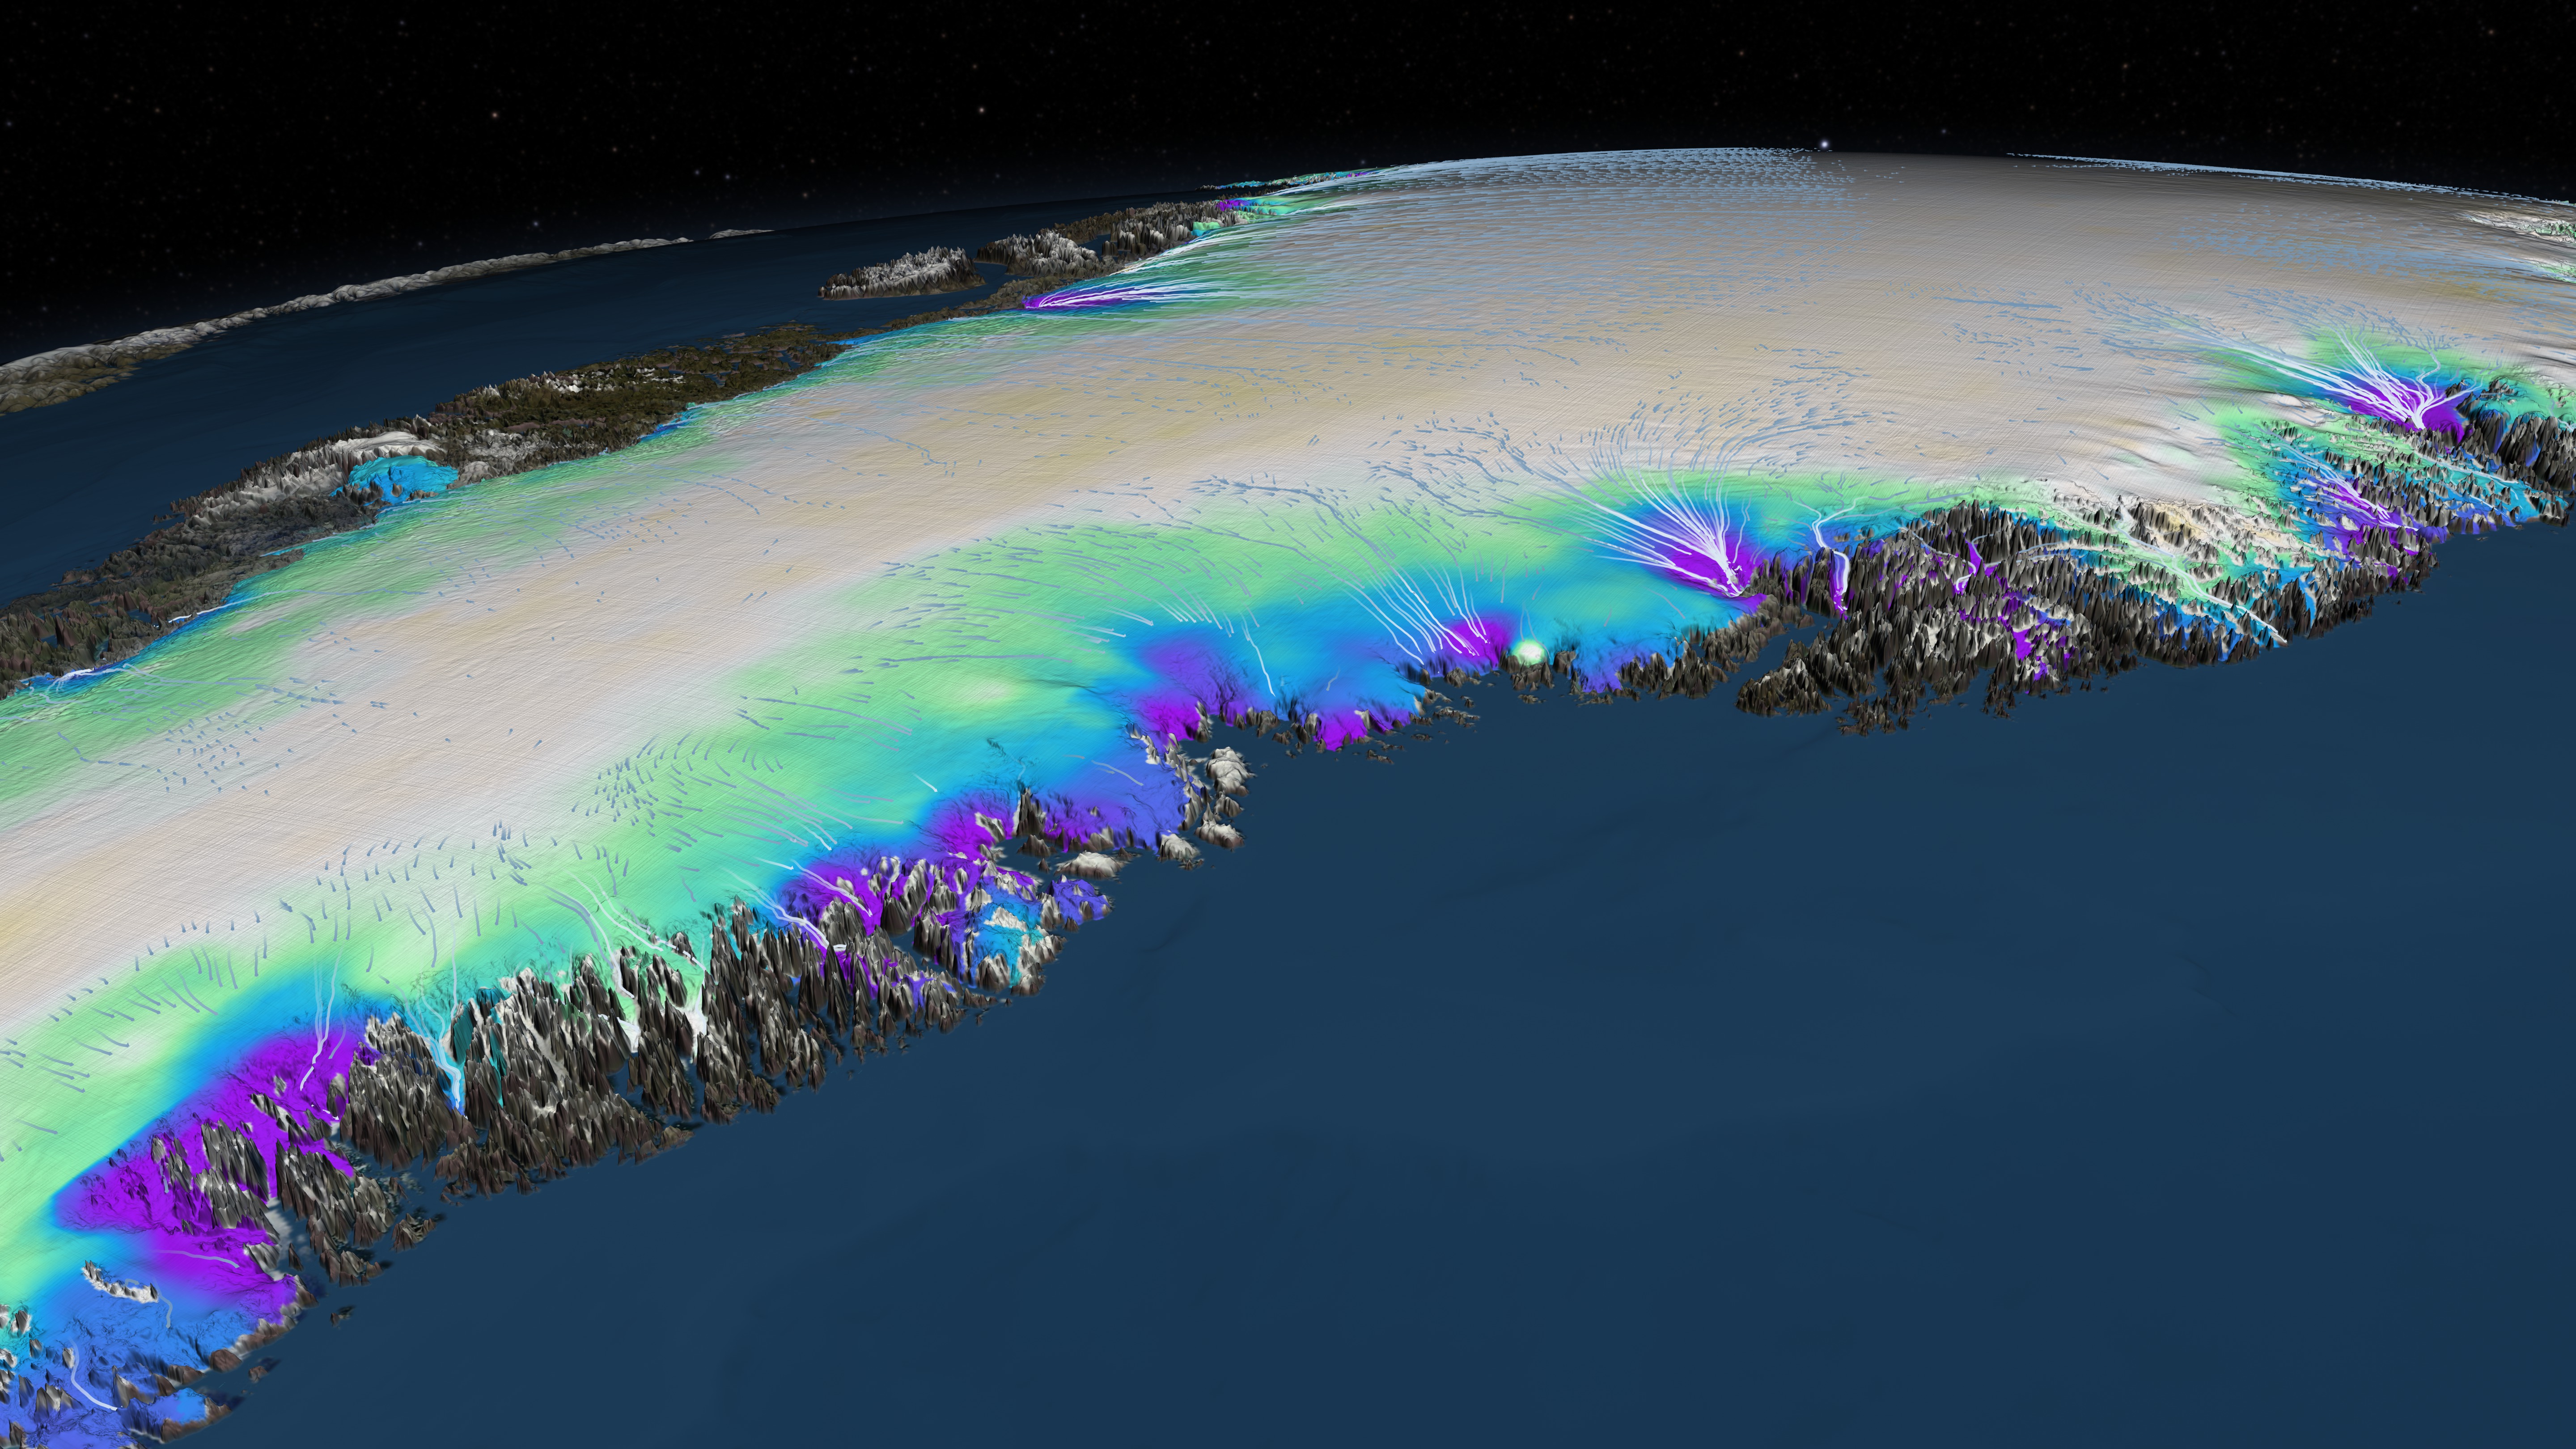
But the new research shows that activity at these four locations may not be representative of what is happening with glaciers across the ice sheet. In fact, glaciers undergo patterns of thinning and thickening that current climate change simulations fail to address, Csatho says.
“There are 242 outlet glaciers wider than 1.5 km on the Greenland Ice Sheet, and what we see is that their behavior is complex in space and time,” Csatho says. “The local climate and geological conditions, the local hydrology — all of these factors have an effect. The current models do not address this complexity.”
The team identified areas of rapid shrinkage in southeast Greenland that today’s models don’t acknowledge. This leads Csatho to believe that the ice sheet could lose ice faster in the future than today’s simulations would suggest.
The results were published on Dec. 15 in the Proceedings of the National Academy of Sciences Early Edition.
How much ice is the Greenland Ice Sheet losing?
To analyze how the height of the ice sheet was changing, Csatho and UB research professor and photogrammetrist Anton Schenk, PhD, developed a computational technique called Surface Elevation Reconstruction And Change detection to fuse together data from NASA satellite and aerial missions.
The analysis found that the Greenland Ice Sheet lost about 243 metric gigatons of ice annually — equivalent to about 277 cubic kilometers of ice per year — from 2003-09, the period for which the team had the most comprehensive data. This loss is estimated to have added about 0.68 millimeters of water to the oceans annually.
The figures are averages, and ice loss varied from year to year, and from region to region.
Why are today’s projections of sea level rise flawed, and how can we fix them?
Glaciers don’t just gradually lose mass when the temperature rises. That’s one reason it’s difficult to predict their response to global warming.
In the study, scientists found that some of Greenland’s glaciers thickened even when the temperature rose. Others exhibited accelerated thinning. Some displayed both thinning and thickening, with sudden reversals.
As a step toward building better models of sea level rise, the research team divided Greenland’s 242 glaciers into 7 major groups based on their behavior from 2003-09.
“Understanding the groupings will help us pick out examples of glaciers that are representative of the whole,” Csatho says. “We can then use data from these representative glaciers in models to provide a more complete picture of what is happening.”
In a new project, she and colleagues are investigating why different glaciers respond differently to warming. Factors could include the temperature of the surrounding ocean; the level of friction between a glacier and the bedrock below; the amount of water under a glacier; and the geometry of the fjord.
“The physics of these processes are not well understood,” Csatho says.
The NASA missions: A colossal undertaking
The study combined data from various NASA missions, including:
- NASA’s Ice, Cloud and Land Elevation Satellite (ICESat), which measured the ice sheet’s elevation multiple times a year at each of the nearly 100,000 locations from 2003-09.
- NASA’s massive aerial survey that employs highly specialized research aircrafts to collect data at less frequent intervals than ICESat. These missions began measuring the Greenland Ice Sheet’s elevation in 1993. Operation IceBridge was started in 2009 to bridge the time between ICESat-1 and ICESat-2, and will continue until at least 2017, when NASA’s next generation ICESat-2 satellite is expected to come online.
Csatho says the new study shows why careful monitoring is critical: Given the complex nature of glacier behavior, good data is crucial to building better models.
Collaborators
The project included contributions from researchers at the University at Buffalo, University of Kansas, Utrecht University in The Netherlands, the Technical University of Denmark and Florida Atlantic University.
Media Contact Information
Charlotte Hsu is a former staff writer in University Communications. To contact UB's media relations staff, email ub-news@buffalo.edu or visit our list of current university media contacts.

