News & information from UB, New York's flagship university
New Greenland Ice Sheet Data Will Impact Climate Change Models
With digital imaging techniques, scientists find new data in old aerial photographs
Release Date: February 11, 2008 This content is archived.


BUFFALO, N.Y. -- A comprehensive new study authored by University at Buffalo scientists and their colleagues for the first time documents in detail the dynamics of parts of Greenland's ice sheet, important data that have long been missing from the ice sheet models on which projections about sea level rise and global warming are based.
The research, published online this month in the Journal of Glaciology, also demonstrates how remote sensing and digital imaging techniques can produce rich datasets without field data in some cases.
Traditionally, ice sheet models are very simplified, according to Beata Csatho, Ph.D., assistant professor of geology in the UB College of Arts and Sciences and lead author of the paper.
"Ice sheet models usually don't include all the complexity of ice dynamics that can happen in nature," said Csatho. "This research will give ice sheet modelers more precise, more detailed data."
The implications of these richer datasets may be dramatic, Csatho said, especially as they impact climate projections and sea-level rise estimates, such as those made by the United Nations Intergovernmental Panel on Climate Change (IPCC).
"If current climate models from the IPCC included data from ice dynamics in Greenland, the sea level rise estimated during this century could be twice as high as what they are currently projecting," she said.
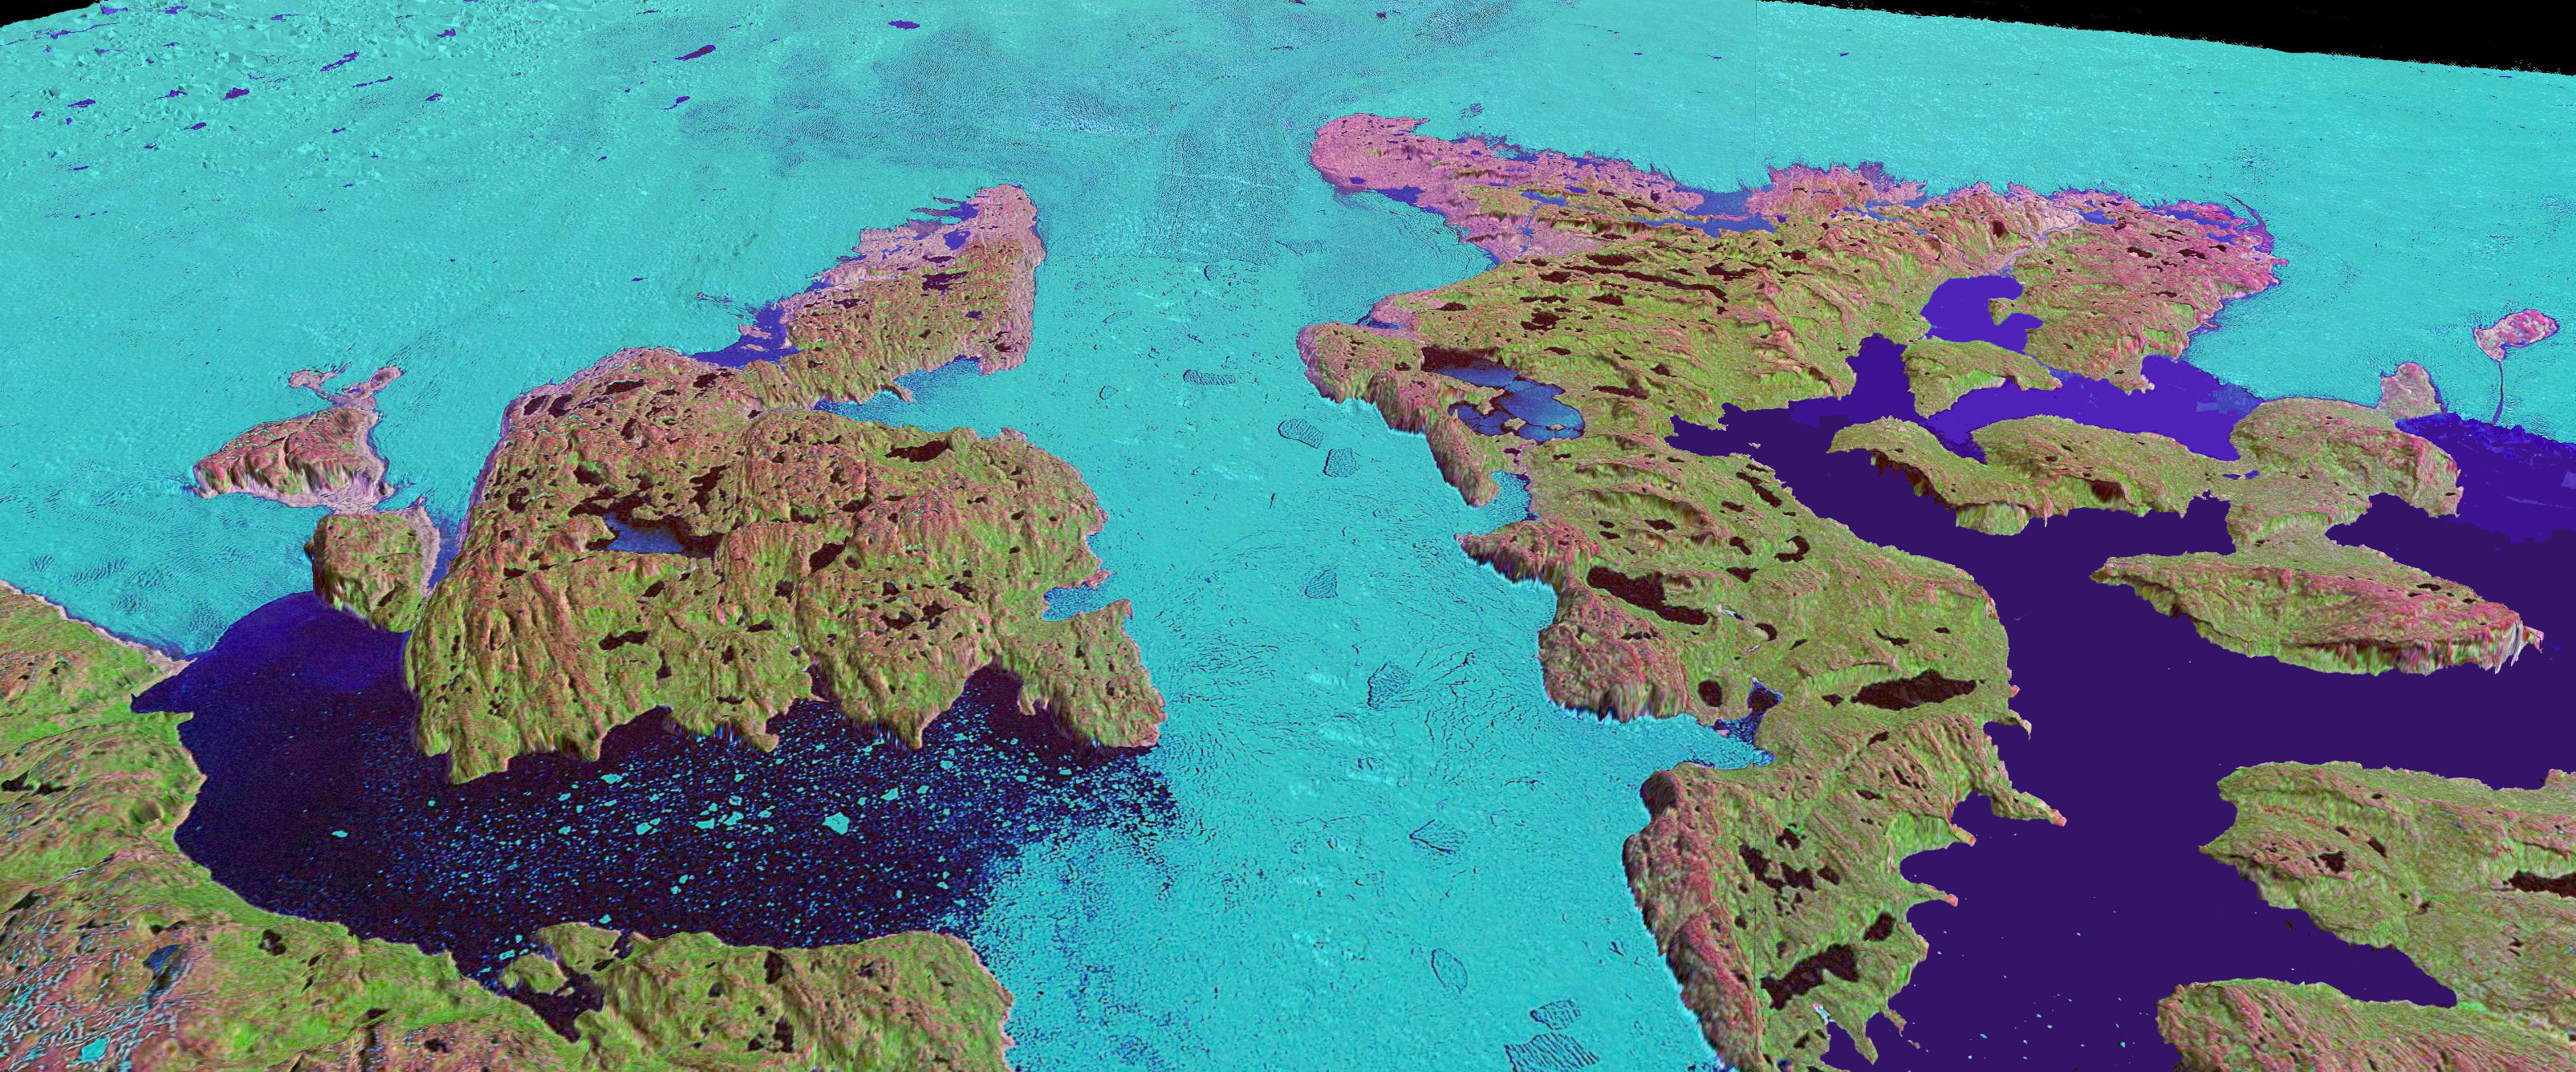
The paper focuses on Jakobshavn Isbrae, Greenland's fastest moving glacier and its largest, measuring four miles wide.
During the past decade, Jakobshavn Isbrae has begun to experience rapid thinning and doubling of the amount of ice it discharges into Disko Bay.
"Although the thinning started as early as the end of the 18th century, the changes we are seeing now are bigger than can be accounted for by normal, annual perturbations in climate," Csatho said.
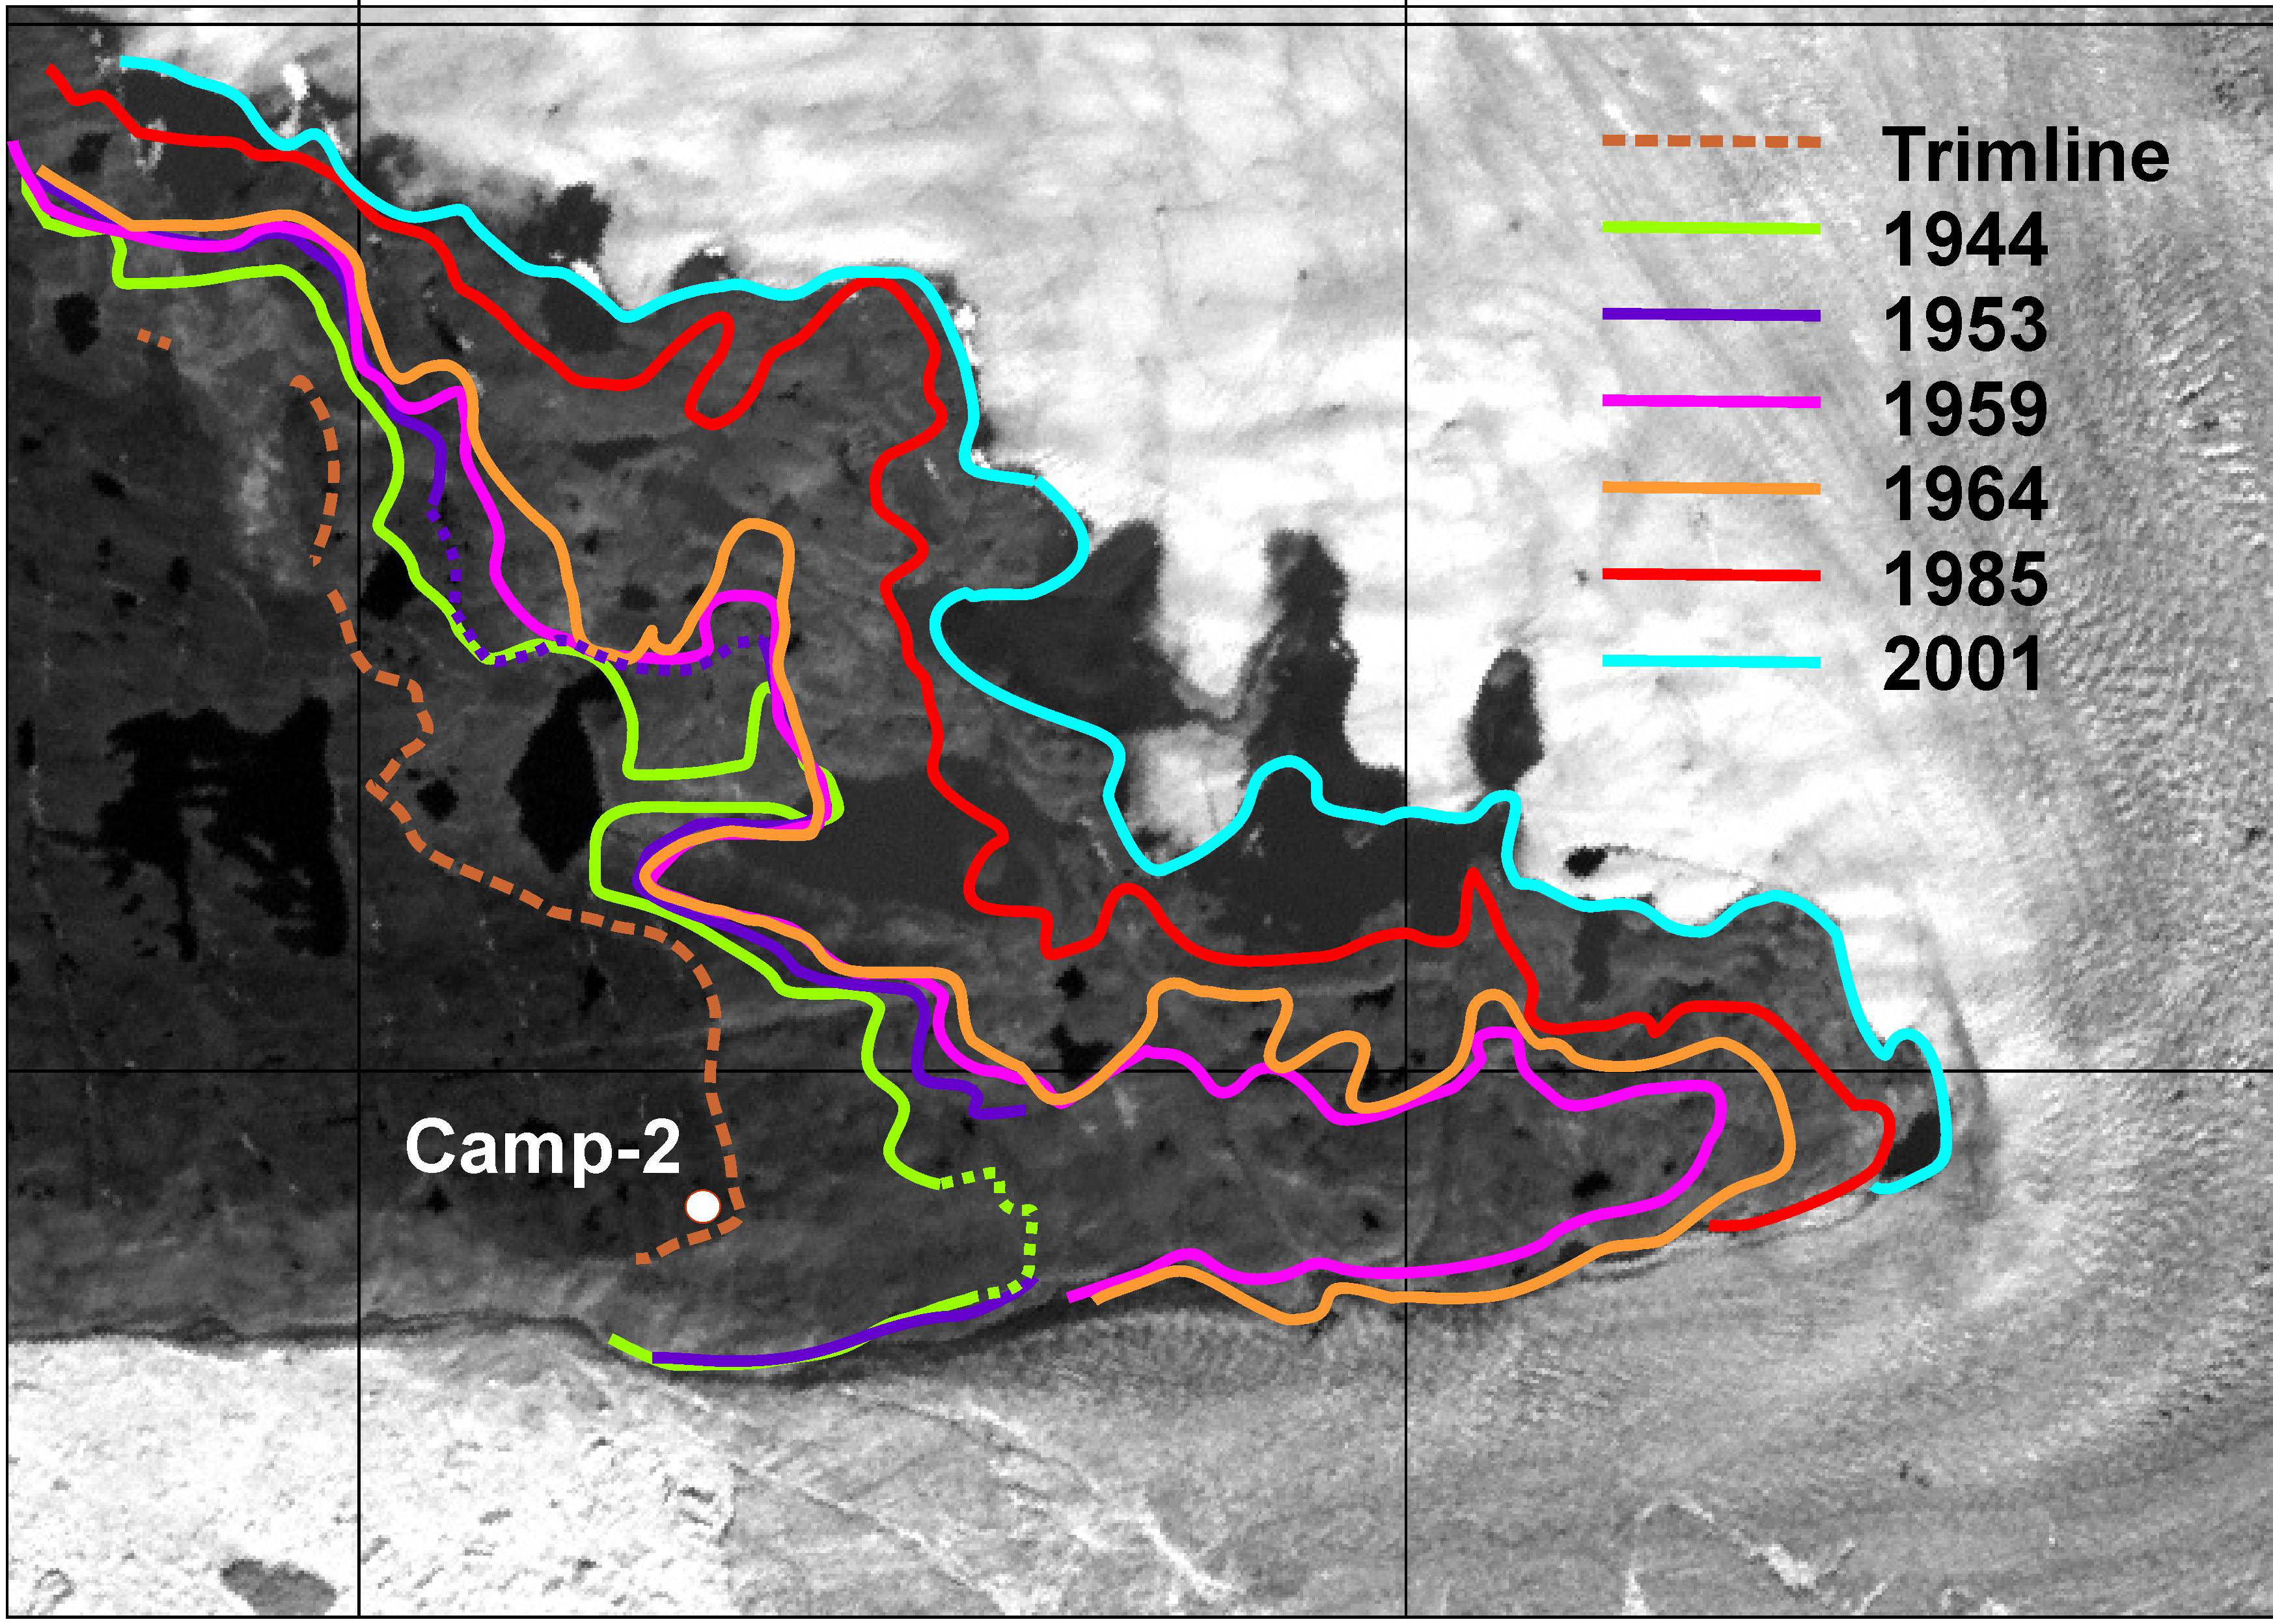
In order to document the most comprehensive story possible of the behavior of Jakobshavn Isbrae since the Little Ice Age in the late 1800s, Csatho and her colleagues at Ohio State University, the University of Kansas and NASA used a combination of techniques.
These included field mapping, remote sensing, satellite imaging and the application of digital techniques in order to glean "hidden" data from historic aerial photographs as many as 60 years after they were taken.
By themselves, Csatho explained, the two-dimensional pictures were of limited value.
"But now we can digitize them, removing the boundaries between them and turning several pictures into a single 'mosaic' that will produce one data set that can be viewed in three-dimensions," she said.
"By reprocessing old data contained in these old photographs and records, we have been able to construct a long-term record of the behavior of the glacier," said Csatho. "This was the first time that the data from the '40s could be reused in a coherent way."
The data from the historic photos were combined with data from historical records, ground surveys, field mapping and measurements taken from the air to document important signs of change in the glacier's geometry.
Csatho explained that conventional methods of assessing change in glaciers have depended on documenting "iceberg calving," in which large pieces at the front of the glacier break off.
"But we found that you can get significant changes in the ice sheet without seeing a change in front," she said.
Other key findings of the paper are that two different parts of the same glacier may behave quite differently and that a glacier does not necessarily react to climate change as a single, monolithic entity.
"Climate forces are complex," Csatho said. "For example, we found that the northern part of Jakobshavn was still thinning while the climate was colder between the 1960s and the 1990s."
Csatho, who is a geophysicist, added that the research is the result of a strong interdisciplinary team involving experts in glaciology, ice sheet modeling and photogrammetry, the science of making measurements based on photographs.
At UB, research in Csatho's remote sensing laboratory -- http://rsl.geology.buffalo.edu/ -- focuses on a multidisciplinary approach that integrates information across the geosciences.
Csatho's co-authors on the paper are Tony Schenk of the Ohio State University Department of Civil and Environmental Engineering and Geodetic Science; Kees van der Veen of the Center for Remote Sensing of Ice Sheets at the University of Kansas, and William B. Krabill of the National Aeronautics and Space Administration's Cryospheric Sciences Branch.
The research was funded by the National Science Foundation and NASA.
The University at Buffalo is a premier research-intensive public university, a flagship institution in the State University of New York system that is its largest and most comprehensive campus. UB's more than 28,000 students pursue their academic interests through more than 300 undergraduate, graduate and professional degree programs. Founded in 1846, the University at Buffalo is a member of the Association of American Universities.
Media Contact Information
Ellen Goldbaum
News Content Manager
Medicine
Tel: 716-645-4605
goldbaum@buffalo.edu

