CNN reports on interdisciplinary paper by Dane Taylor, Jingjie Hu, and Brian Quigley
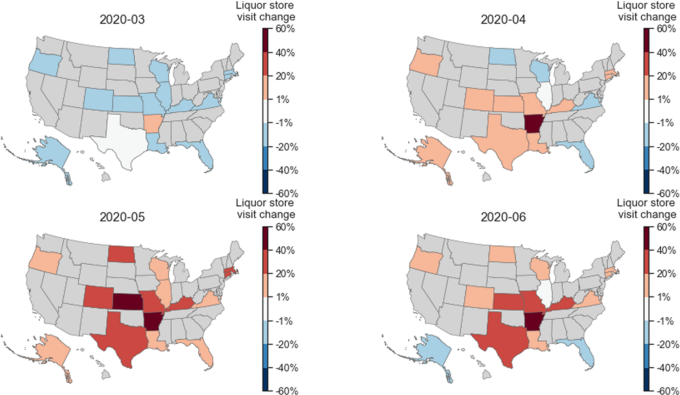

Fig 11. Geographic differences for how the per capita visits to liquor stores changed in response to COVID-19. Image is here.
CNN Health—We really did buy more alcohol during the early pandemic, study finds: As many U.S. states implemented stay-at-home orders beginning in March 2020, anecdotes reported a surge in alcohol sales, raising concerns about increased alcohol use and associated ills. The surveillance report from the National Institute on Alcohol Abuse and Alcoholism provides monthly U.S. alcohol sales data from a subset of states, allowing an investigation of this potential increase in alcohol use. Meanwhile, anonymized human mobility data released by companies such as SafeGraph enables an examination of the visiting behavior of people to various alcohol outlets such as bars and liquor stores. The study's coauthors are: Yingjie Hu, assistant professor in the department of geography; Brian Quigley, a research assistant professor of medicine in the Jacobs School of Medicine and Biomedical Sciences; and, Dane Taylor, assistant professor in the department of mathematics. Their study examines changes to alcohol sales and alcohol outlet visits during COVID-19 and their geographic differences across states. See research news by Charlotte Hsu.
Research News
Study explores pandemic-related shifts in alcohol sales across 16 U.S. states
By CHARLOTTE HSU
Published January 10, 2022
An analysis of data from 16 U.S. states suggests that the first few months of the COVID-19 pandemic saw increases in wine and spirit sales, accompanied by notable changes in the relationship between alcohol sales and people’s visits to businesses that sell alcohol.
UB researchers Yingjie Hu, Brian M. Quigley and Dane Taylor present these findings in the open-access journal PLOS ONE on Dec. 17. The team notes that trends varied by state.
After U.S. states implemented stay-at-home orders and other restrictions to reduce the spread of COVID-19 in March 2020, anecdotes suggested an increase in alcohol sales. However, data-driven investigations into whether alcohol sales and use did indeed increase have produced mixed results.
To help clarify the potential impact of COVID-19 lockdowns and other social distancing measures on the dynamics of alcohol sales, Hu and colleagues conducted an analysis of relevant data from 16 U.S. states, comparing the period from March to June 2020 to the same period in 2018 and 2019.
“Anonymized human mobility data and geospatial analysis help us understand how people’s visiting behavior to alcohol outlets changed during the stay-at-home period of COVID-19, and how such behavior change varied across different geographic regions,” says Hu, assistant professor of geography, College of Arts and Sciences.
“Understanding how alcohol purchase behavior is changed by events such as COVID is important because heavy alcohol use is known to be associated with numerous social problems, especially within the home,” adds Quigley, research assistant professor of medicine in the Jacobs School of Medicine and Biomedical Sciences at UB and the UB Clinical and Research Institute on Addictions.
Using a variety of analytical techniques, including machine-learning methods, they evaluated monthly alcohol sales data reported by the U.S. National Institute on Alcohol Abuse and Alcoholism (NIAAA), as well as anonymized mobility data from over 45 million smart mobile devices (mostly smartphones) indicating people’s visits to businesses where alcohol is sold. (The NIAAA data used in the study focuses on monthly sales of alcohol for 14 U.S. states. It includes sales of spirits, wine and beer, but not all states report data in all of those categories. The anonymized mobility data included information for these 14 states, plus two others.)
The analysis found that overall, sales of spirits and wine increased in the early months of the pandemic — by as much as 20-40% in some states in certain months — while beer sales declined overall compared to the same period during recent years. Meanwhile, people’s visits to bars and pubs declined, but visits to liquor stores increased.
Dynamics varied significantly across states. For example, while beer sales decreased in most states between March and June 2020 compared with the same months in recent years, they increased in Kansas, Arkansas and Texas. Meanwhile, Texas, Kentucky and Virginia showed sustained increases in their sales of both spirits and wine, which the authors suggest “can be alarming signals for problematic alcohol use.”
“If data can provide information about geographic areas in which alcohol use increases during certain types of events such as during severe weather, high unemployment, or events such as the COVID pandemic, this information can be useful to help prepare law enforcement, medical professionals and substance use disorder treatment providers to address alcohol-related issues associated with such times,” Quigley says.
Machine-learning assessments in the study point to a significant shift in the relationship between alcohol sales data and visits to various alcohol outlets. More research will be necessary to understand how people’s behaviors changed, but these findings suggest the possibility that some states may have seen an increase in online alcohol purchases or panic buying of spirits and wine.
The research team notes that the study has some limitations. For example, many states were not included in the NIAAA dataset, and the human mobility data was not able to capture alcohol sales at places such as grocery stores, where sales of alcohol are mixed with sales of other items. Nevertheless, these results provide insights into the potential effects of lockdown policies on alcohol use and could inform future public health policies to address alcohol-related social issues, the researchers say.
From a research methodological perspective, Taylor, assistant professor of mathematics, notes: “Interfacing new data sources such as anonymized human mobility data with public health challenges that are difficult or expensive to directly measure reveals new methodological challenges for applied machine learning research.”