News & information from UB, New York's flagship university
Federal fire protection grant disbursement system could be more balanced, study suggests

States such as Alabama, Ohio and Pennsylvania received more than their fair share in 2014, according to new model, while Florida, Texas and others were shortchanged
Release Date: February 25, 2019 This content is archived.


BUFFALO, N.Y. — The federal government considers many factors when dividing money nationwide to prevent structure fires. The key driver, however, is economic losses — for example, the greater the cost of fire within a state, the more aid that state is likely to receive.
A new model developed by University at Buffalo engineers emphasizes an additional factor: the losses associated with human fatalities and injuries. That tweak throws the current system off-track, suggesting that some states receive an outsized share of fire protection money, while others are shortchanged.
“Models can always be improved. We hope this will be a new tool that helps emergency planners save more lives,” says the study’s lead author Jun Zhuang, PhD, professor in the Department of Industrial and Systems in Engineering in the School of Engineering and Applied Sciences at the University at Buffalo.
The model, described in a study published Jan. 16 in the journal Risk Analysis, is applicable to structural fires — those involving residential, commercial and industrial buildings. It is not intended for prevention efforts involving wildfires, vehicle fires and other outdoor fires.
The use of models to calculate costs associated with fires dates back nearly 100 years. Over the years, these models have grown more sophisticated, especially with advancements in computing and risk analysis.
An example of this is a 2017 report written by Zhuang and issued by the National Fire Protection Association. It identified the total cost of structural fires in the United States in 2014 at $328.5 billion.
In the Risk Analysis study, Zhuang and co-authors Vineet M. Payyappalli (PhD candidate in Zhuang’s lab) and Adam Behrendt (a UB alumnus who studied under Zhuang) created fire risk scores for all 50 states using data from 2005-15. These scores indicate how likely someone is to be affected by a structure fire given the state they live in.
States with highest risk scores were Alaska, Montana, North Dakota, South Dakota, Vermont and Wyoming, according to the model. States with the lowest risk scores were Arizona, California, Florida, Illinois, North Carolina, New York, Pennsylvania and Texas.

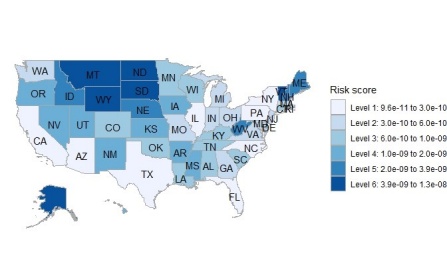
The map above shows fire risk scores by state. The darker the color, the more at risk people are to structure fires. Credit: University at Buffalo.
The researchers also tracked how much money the federal government spent on the Assistance to Firefighters Grant (AFG) program in 2014.

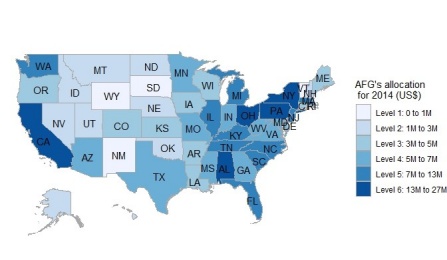
The map above shows how much money states received via the federal Assistance to Firefighters Grant program in 2014. The darker the color, the more money the state received. Credit: University at Buffalo.
They then ran the new model, which suggested that Alabama, Ohio, Pennsylvania and other states received more aid than they should have. Conversely, states such as Florida and Texas received less aid than what the model allots for.

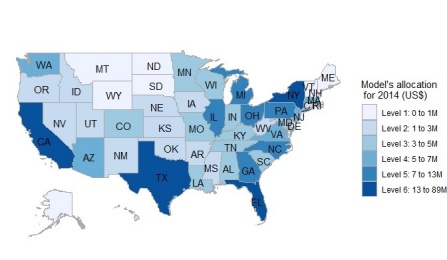
The map above shows how much money states would have received via the federal Assistance to Firefighters Grant program in 2014 under the new model. The darker the color, the more money the state would receive. Credit: University at Buffalo.
The new model has limitations. For example, California and Texas are outliers because of their populations and gross domestic product. Also, calculations could change based on how human lives and injuries are valued.
Additionally, AFG allocations only account for less than 1 percent of state and local government expenditures. Finally, losses reported in the National Fire Incident Reporting System, under which the fire risk scores were calculated, cover only 75 percent of all fire incidents nationwide.
The team plans to further refine the model, consider other factors and update statistics to provide an even more robust tool for emergency planners.
“The model can be used for decision making not just at state-level. It can be used for counties, even ZIP codes,” says Zhuang. “The more information fire protection officials have, the more informed decisions they can make, and the more lives they can help save.”
Media Contact Information
Cory Nealon
Director of Media Relations
Engineering, Computer Science
Tel: 716-645-4614
cmnealon@buffalo.edu

