
Archives
Cars back on Main Street
CCR visualization gives view of return of vehicular traffic
By ELLEN GOLDBAUM
Contributing Editor
The visualization capabilities of UB's Center for Computational Research (CCR) are providing city residents with a multifaceted, interactive, real-time visualization of what activity on Main Street in the heart of downtown Buffalo would be like if vehicular traffic returns after an absence of more than 20 years.
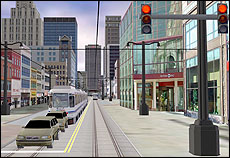
The three-dimensional, real-time traffic visualization presented by UB computer scientists allows the public to see how the proposed integration of car and rail traffic would work on Main Street before any of the actual construction begins
Vehicular traffic was eliminated from approximately 11 blocks of Main Street with the creation of a light-rail, rapid-transit system and a pedestrian mall.
With hopes of revitalizing commerce on Main Street, the City of Buffalo, the Niagara Frontier Transportation Authority (NFTA) and other partners now have proposed a shared right-of-way for the rail system and vehicles.
But what would that be like? How would trains and cars coexist on Main Street? What would the experience be like for pedestrians?
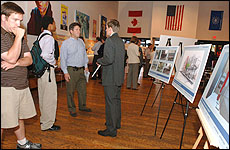
Members of the public study designs of
the visualizations during a recent open house in the Market Arcade Film
and Arts Center.
PHOTO: NANCY
J. PARISI
The answers are provided in a visualization—"Cars Sharing Main Street"—prepared and presented to the public recently by CCR, part of UB's New York State Center of Excellence in Bioinformatics and Life Sciences.
CCR urban visualization and simulation specialists Martins Innus, Adam Koniak and Adrian Levesque, who developed the simulation, demonstrated the "Cars Sharing Main Street" visualization for the public during an open house in the Market Arcade Film and Arts Center.
"The three-dimensional, real-time traffic visualization allows the public and planners to see how the proposed integration of car and rail traffic would work on Main Street before any of the actual construction begins," said Koniak.
The extremely detailed visualizations virtually "immerse" spectators in the traffic data so that they can "experience" the traffic as if they were standing on a street corner, riding on a Metro train or driving along Main Street. Merchants will be able to view the flow of automobile and pedestrian traffic from the perspective of their storefronts.
CCR visualization specialists developed the simulations for DiDonato Associates in the "Cars Sharing Main Street" project for Buffalo, NFTA and Buffalo Place.
The purpose of these visualizations, said Thomas R. Furlani, CCR director, is informational: to convey in a readily understandable way what is being proposed with the return of vehicular traffic to Main Street and to demonstrate to the public the scope of the project and its potential impact on surrounding neighborhoods.
"The old adage that a picture is worth a thousand words is still applicable today, maybe more so as we have become a much more visually driven society," Furlani said.
Koniak added that if the project is to move forward, the public has to understand what is being proposed and feel comfortable that it will have a positive impact.
"The merchants on Main Street want to know if traffic will flow smoothly in front of their stores," he said. "The people who travel downtown want to know, 'Will it be easy to get around?' These visualizations go a long way toward showing the public what happens when you mix automobile traffic with pedestrians and rapid transit."
The visualizations demonstrate, for example, typical waiting times and queue lengths for cars waiting at intersections that people can expect to see on Main Street if automobiles are reintroduced.
"The visualizations can alleviate the concern of the public that this change will cause major bottlenecks," said Levesque.
CCR's capability in visualizations for urban-planning applications developed out of its efforts in high-end and scientific visualization for applications such as medical imaging and data-intensive visualization, some of which required supercomputers a decade ago.
Now, Innus said, CCR does all its urban visualization and simulation on laptop computers.
That's critical, he added, because it allows these visualizations to be presented publicly in a town-hall-type setting—like the recent open house—to reach as large an audience as possible.
Working in partnerships with local companies and agencies, CCR has developed software that applies these state-of-the-art technologies for a wide variety of projects covering everything from the design of high-speed toll barriers, to the Peace Bridge, to the Olmsted Parks in Buffalo, to major roadway-improvement projects in other states.
The work always is carried out in concert with local engineering and architectural firms and serves to provide them with a competitive advantage that they can use to help grow the local economy, said Furlani.
"It's important for the university, as a member of the Western New York community and as a new and growing member of the downtown Buffalo community in particular, to help wherever possible as the city expands and grows," he added.
CCR also developed visualizations for the Buffalo Niagara Medical Campus, now CCR's new home after recently relocating there from the North Campus to be part of the Center of Excellence.