Hazard
Maps mitigate volcanic risk
UB volcanologists are using advanced technologies
to help safeguard populations
By
ELLEN GOLDBAUM
Contributing Editor
Volcanologists
at UB, leaders worldwide in using advanced technologies to safeguard
populations from dangerous geologic events, are pioneering the automation
of the time-consuming and expensive process of developing volcanic hazard
maps.
| |
 |
| |
UB
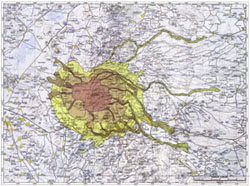
geologists have developed a volcanic hazard map that reveals levels
of hazard based on their probability. |
| |
|
They presented
their newest hazard map, developed for the volcano Pico de Orizaba,
Mexico's highest mountain, earlier this month in Mexico City with their
collaborators at UNAM, the National University of Mexico.
This is
the third such hazard map of a Mexican volcano developed by Michael
F. Sheridan, professor of geology, and colleagues using computer simulations
of volcanic phenomena.
It was
developed by applying advanced remote-sensing techniques that allow
scientists to identify weak zones in the volcano's surface.
Hazard
maps are a primary tool of government agencies in determining how to
plan for potentially dangerous geologic events, but relying primarily
on traditional methods, such as fieldwork, to construct them is extremely
time-consuming and expensive.
By combining
state-of-the-art technologies with computer simulations that illustrate
where and how past eruptions and mudslides occurred at the volcano,
scientists are able to much more quickly and accurately get detailed
hazard maps into the hands of the officials charged with keeping their
citizens safe.
Developed
in close connection with local civil-protection authorities, the hazard
map for Pico de Orizaba provides the Mexican government, local authorities
and the general population with the first detailed look at which communities
could be affected by a variety of events at the volcano, ranging from
landslides and mudflows to full-scale eruptions.
The nearest
large city to Pico de Orizaba is Vera Cruz, which has a population of
nearly 2 million and is located just 60 miles from the volcano.
The map
was developed based on extremely detailed data gathered by remote sensing
using advanced spectral-sensing technologies.
While previous
maps of the volcano were limited to displaying only "worst case" scenarios,
this one reveals three levels of hazard, based on their probability—those
that are the most frequent, most dangerous and which occur nearest to
the volcano's crater; less frequent but larger events, and the largest,
least frequent and least dangerous events, which would impact populations
furthest from the crater.
"This map
confirms that we are very close to our goal of automating the process
of making hazard maps," said Sheridan, principal investigator on the
project.
"We have
shown we can develop these maps in a relatively short period of time
using relatively few resources," he said.
Funded
by NASA, Sheridan and Bernard Hubbard, former UB doctoral candidate,
and their colleagues at UNAM, led by Dante Moran, used a NASA-developed
technology called AVIRIS (Airborne Visible/Infrared Imaging Spectrometer)
to detect remotely altered rock and other potentially dangerous features
on volcanoes that cannot be detected easily through traditional fieldwork.
The sensors
are located on a small airplane and collect highly detailed data—224
channels of spectral data for every pixel, representing a 100-yard square
on the ground.
The technology
has allowed the UB researchers to develop an incredibly detailed, and
previously unavailable, picture of the stability—or instability—of a
volcano's surface.
"When we
use our eyes to look at the earth's surface, we are seeing only within
a very narrow range of the visible spectrum," explained Sheridan. "But
every mineral reflects its own unique spectrum of peaks and valleys
that allows us to detect key mineral signatures in the infrared spectrum
or beyond."
Until very
recently, standard remote-sensing technologies only could provide such
geologic signatures in very general terms because data was coming back
in seven broad channels, in a more restricted range.
By contrast,
the hazard map for Pico de Orizaba is based on sensing technology that
provides data simultaneously on 224 separate channels, an improvement
so dramatic that Sheridan at first could barely believe the readings.
"I couldn't
believe you could identify just a percent or two of clay in an area
the size of a football field, for example, but it turns out that with
this technology, you can," he said.
According
to Sheridan, the presence of clay or sulfur-bearing mineral is a possible
indication of a weak zone, an area that could potentially initiate a
slide that could present a danger to local populations, especially in
the event of a major rainstorm.
"These
weak areas can lubricate the fractures that exist inside each volcano,
potentially causing an event of major magnitude, such as causing a whole
side of a volcano to just slide off, as happened at Mt. St. Helens,"
he explained.
The spectral
data also revealed that in some cases at Pico de Orizaba, the rock has
been completely altered by hot acid solutions that circulate throughout
the volcano, potentially weakening areas deep within it, as well as
at its surface.
While such
discoveries sound alarming at first, Sheridan noted that they are deep
rock alterations, probably present to some extent in all volcanoes;
it is just that the technologies that allowed such a precise picture
only recently became available.
"It's not
that nature is surprising, it's that we are surprised when we discover
another piece that helps to explain how it all works," he said.
