Enrollment Modeling Tools
Increased understanding of the underlying impact metrics that drive changes in outcomes is a great first step. The reality is that numerous metrics have potential impact, and to different degrees, so where do you start? Enrollment modeling tools are available to the campus community that give users the ability to “turn dials” up or down on selected metrics to see the resultant outcome changes over multiple years.
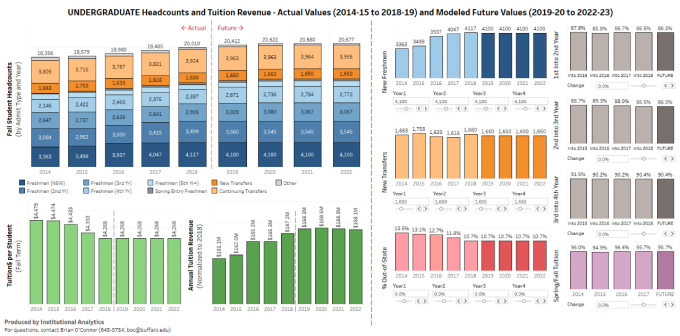
Campus-wide View
4-Year Undergraduate Heads and Revenue

Individual School View
4-Year Undergraduate Heads and Revenue
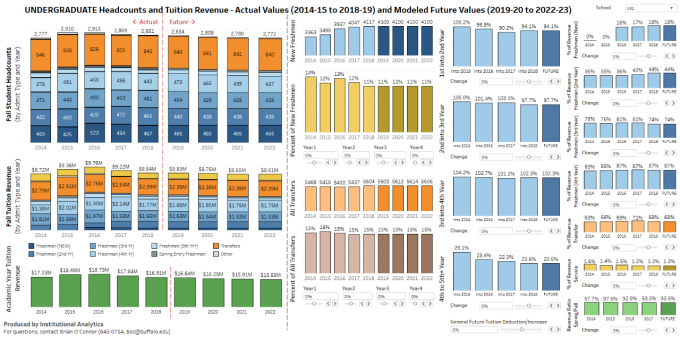

Users can make changes to future values for selected metrics, with 4-5 years of metric histories shown for reference (right side of dashboard). After the model implements the selected changes, resultant changes to headcounts and revenue for the next four years are available on the left side of the dashboard. There are 16 impact metrics that users can change for the campus-wide version and 20 impact metrics that users can change for the school version.
Groupings of these user-adjustable impact metrics include:
- Incoming freshmen cohort size and distribution by school
- Total transfer population and percent distribution by school
- Year-by-year major migration rates (1st to 2nd, 2nd to 3rd … etc.)
- Percent of major tuition revenue credited to school by year
- Comparisons of fall-to-spring total tuition revenue ratios
- Revenue generated from service to school non-majors
- Potential future percentage changes in base tuition rates
- Overall residency percentages and distribution by school
For further information on these modeling tools, contact
Brian J. O'Connor
Phone: (716) 645-0754
Email: boc@buffalo.edu