Dashboard of Dashboards
The Dashboard of Dashboards (DoD) was developed to simplify users’ access to some key campus dashboard sets, without requiring them to navigate through lists of Tableau sites and projects. It serves as a “one stop” launch page for the current Institutional Analytics dashboards available to the campus.
To create actionable intelligence, raw datasets must be transformed, analyzed for patterns and relationships that create new understandings, then presented in a simplified form that gives users insight to inform needed actions. All of the dashboard sets shown below, along with many others currently under development, are designed with that exact purpose in mind. Regular changes are made to these tools based on direct feedback from our users, and additional needs identified during frequent meetings with key partners.
Select Dashboard of Dashboard (DoD) to login to the Tableau Server. Authentication required.
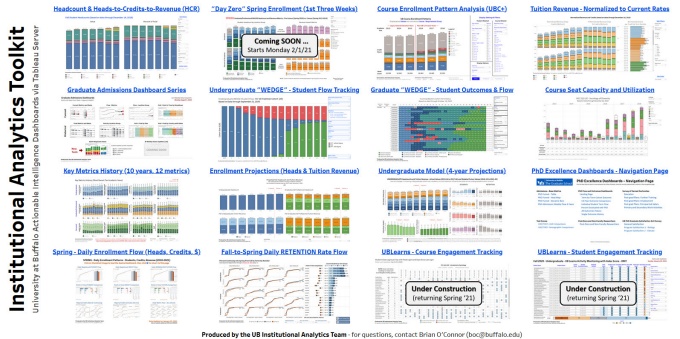

The current DoD dashboard sets include:
- Headcount and Heads-to-Credits-to-Revenue (HCR)
- “Day Zero” Enrollment & Revenue Analysis
- Course Enrollment Pattern Analysis (UBC+)
- Tuition Revenue – Normalized to Current Rates
- Graduate Admissions Dashboard Series
- The WEDGE – Undergraduate Student Flow Tracking
- The Graduate WEDGE - Student Outcomes & Flow
- Course Seat Capacity and Utilization
- Key Metrics History (10 years, 12 metrics)
- Enrollment Projections (Heads and Tuition Revenue)
- Undergraduate Model (4-year Projections)
- Navigation Page to the PhD Excellence Dashboards
- Daily Registration Flow (Heads, Credits, Revenue)
- Daily Retention Rate Flow by Point in Student Career
- UBLearns - Course-by-course Engagement Tracking
- UBLearns - Individual Student Engagement in Courses
For further information on these dashboards, contact
Brian J. O'Connor
Phone: (716) 645-0754
Email: boc@buffalo.edu